Figures & data
Figure 1 Single angle vector plot for actual (A) versus simulated (B) residual refractive astigmatism.
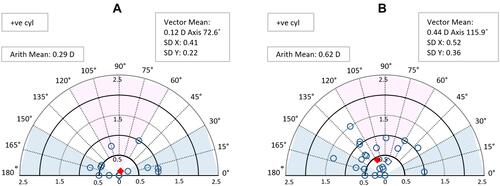
Figure 2 Frequency distribution histograms of difference between actual versus simulated residual refractive astigmatism.
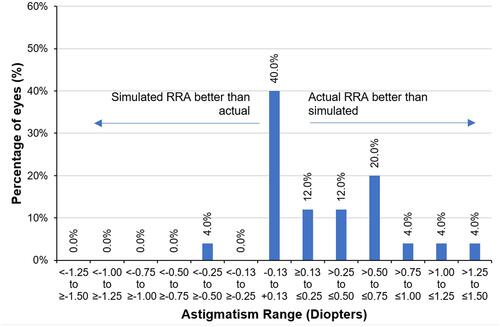
Figure 3 Double angle vector plot for actual versus simulated residual refractive astigmatism in eyes with change in treatment type (17 eyes).
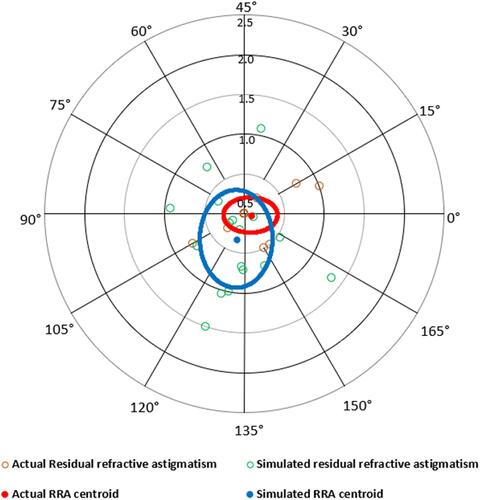
Table 1 Change in Treatment Type (None, LRI, or Toric IOL) Determined from Pre-TPS vs Post-TPS Keratometry
Figure 4 Single angle vector plot for pre-TPS (A) versus post-TPS (B) keratometric astigmatism.
Abbreviation: TPS, thermal pulsation system.
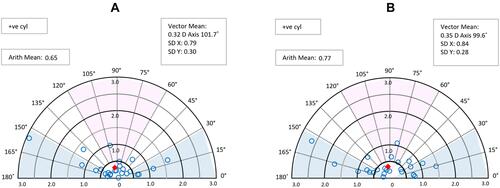
Figure 5 Frequency distribution histogram of difference between pre-TPS and post-TPS keratometric astigmatism.
Abbreviation: TPS, thermal pulsation system.
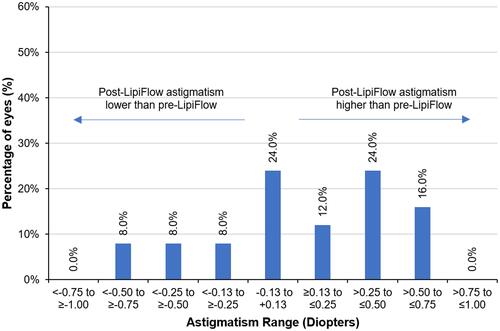
Table 2 Change in the Axis of Keratometric Astigmatism from Pre-TPS to Post-TPS
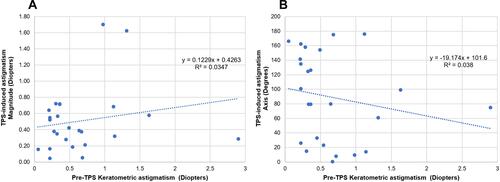
Figure 6 Scatter plots (A) between TPS-induced change in astigmatism magnitude and pre-TPS keratometric astigmatism;, and(B) between change in astigmatism axis and pre-TPS keratometric astigmatism.
Abbreviation: TPS, thermal pulsation system.