Figures & data
Table 1 Key Eligibility Criteria
Table 2 Demographic and Baseline Characteristics (Full Analysis Set)
Figure 1 (A) Change from baseline in dry eye symptom scores on Day 1 (Overall population, N=134). Baseline data for one patient was missing. The change from baseline in median (95% CI) dry eye symptom scores at 0 h, 4 h, and 8 h post-dose were –1 (–3, –1), –2 (–3, –2), and –2 (–2, –1), respectively. Patient-reported outcome assessment of dry eye symptoms was performed using 0 −10 visual analog scale at 4 time points on Day 1 (baseline, 0 (immediate), 4 (±1), and 8 (±1) hours post-drop instillation; 0–5 = none to minimal symptoms; 6–10 = moderate to severe symptoms). Baseline was defined as the last available, non-missing, scheduled or unscheduled value collected prior to exposure to study treatment. (B) Change from baseline in dry eye symptom scores on Day 1 (by subtype). Baseline and 0 h data for one patient each in aqueous deficient group was missing. Median reduction in symptom score was >1 point at all post-dose time points for all the subtypes. Patient-reported outcome assessment of dry eye symptoms was performed using 0 (no symptoms/eyes feeling good) –10 (worst symptoms/no feeling at all) visual analog scale at 4 time points on Day 1 (baseline, 0 (immediate), 4 (±1), and 8 (±1) h post-drop instillation; 0–5 = none to minimal symptoms; 6–10 = moderate to severe symptoms). Baseline was defined as the last available, non-missing, scheduled or unscheduled value collected prior to exposure to study treatment.
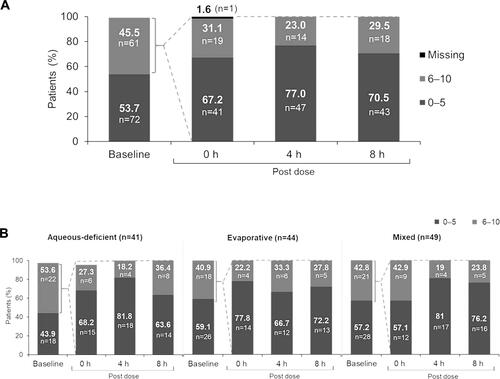
Figure 2 (A) Soothing sensation scores on Day 1 (Overall population, N=134). The median (range) soothing sensation scores at 0, 4, and 8 h post-dose were 3 (0–10), 3.0 (0–10), and 3.5 (0–10), respectively. Patient-reported outcome assessment of soothing sensation was performed using 0 (no symptoms/eyes feeling good) −10 (worst symptoms/no feeling at all) visual analog scale at 4 time points on Day 1 (baseline, 0 (immediate), 4 (±1), and 8 (±1) h post-drop instillation; 0–5 = none to minimal symptoms; 6–10 = moderate to severe symptoms). (B) Soothing sensation scores on Day 1 (by subtype). Patient-reported outcome assessment of soothing sensation was performed using 0 (no symptoms/eyes feeling good) −10 (worst symptoms/no feeling at all) visual analog scale at 4 time points on Day 1 (baseline, 0 (immediate), 4 (±1), and 8 (±1) h post-drop instillation; 0–5 = none to minimal symptoms; 6–10 = moderate to severe symptoms).
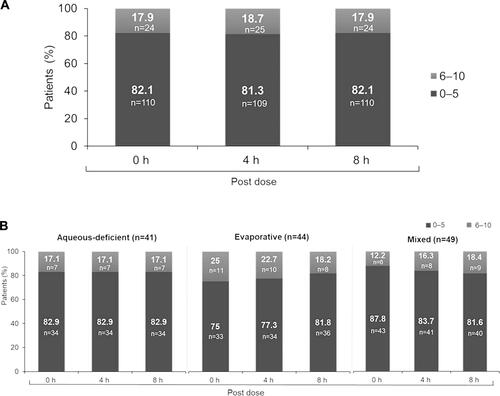
Table 3 Dry Eye Symptom Score (0–5, 6–10): Shift Table Between Subsequent Time Points on Day 1
Table 4 Soothing Sensation Score (0–5, 6–10): Shift Table Between Subsequent Time Points on Day 1
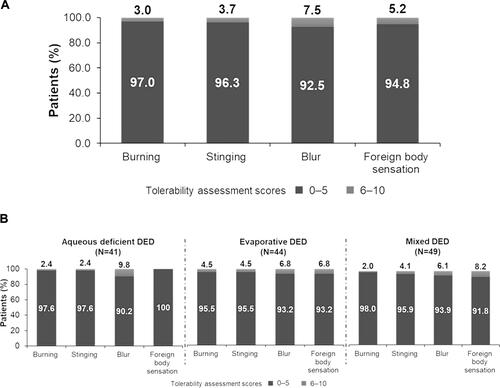
Figure 3 (A) Tolerability assessment score on Day 1 (Overall population). Tolerability profile was assessed on a 0–10 scale (0=no symptoms; 10=worst imaginable symptom experienced; 0–5=none to mild symptoms; 6–10=moderate to severe symptoms). (B) Tolerability assessment score on Day 1 (by subtype). Tolerability profile was assessed on a 0–10 scale (0=no symptoms; 10=worst imaginable symptom experienced; 0–5=none to mild symptoms; 6–10=moderate to severe symptoms).