Figures & data
Table 1 Comparison of Mean Values of Refractive Measurements Between Autorefractometers
Table 2 Comparison of Mean Keratometric Values Between Both Devices
Table 3 Correlations Between Variables of Both Devices in Both Positions and Subjective Refraction
Table 4 Differences in Mean Refractive Components Between Autorefractometers
Figure 1 Bland–Altman plots of the differences in spherical equivalence (SE) between Huvitz and Nidek sitting (A), Huvitz and Nidek supine (B), and Nidek sitting and Nidek supine (C). Huvitz and subjective refraction. (D). Nidek sitting and subjective refraction (E). Nidek supine and subjective refraction (F).
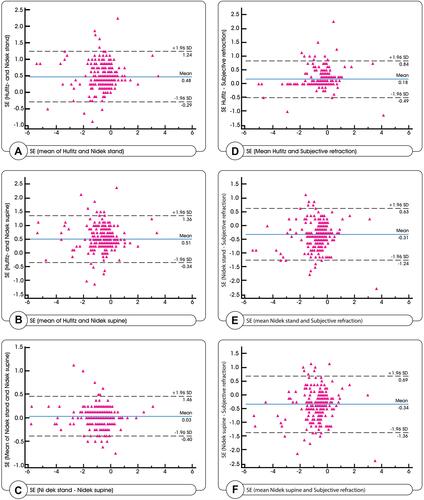
Figure 2 Bland–Altman plots of the differences in J0 between Huvitz and Nidek sitting (A), Huvitz and Nidek supine (B), and Nidek sitting and Nidek supine (C). Huvitz and subjective refraction. (D). Nidek sitting and subjective refraction (E). Nidek supine and subjective refraction (F).
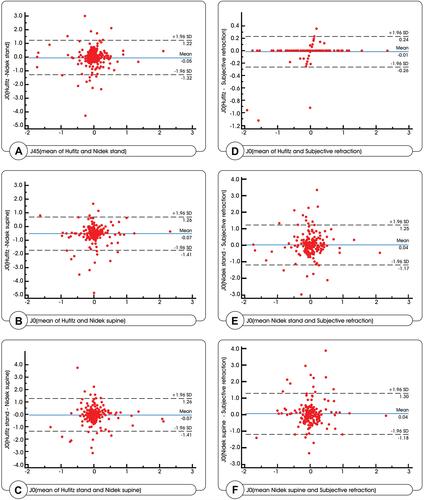
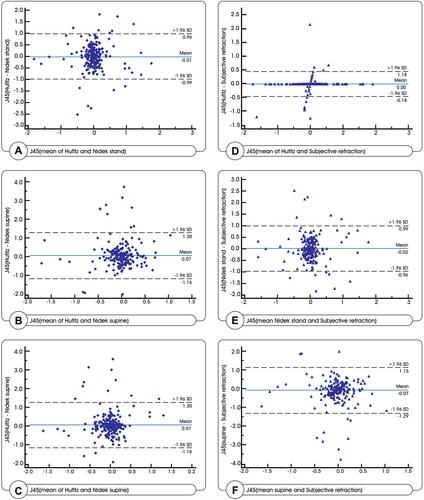
Figure 3 Bland–Altman plots of the differences in J45 between Huvitz and Nidek sitting (A), Huvitz and Nidek supine (B), and Nidek sitting and Nidek supine (C). Huvitz and subjective refraction. (D). Nidek sitting and subjective refraction (E). Nidek supine and subjective refraction (F).