Figures & data
Table 1 Number of Cataract Surgeries Performed in the Three Study Periods
Table 2 Economic Analysis of the Redesign
Figure 1 NHS Fife cataract referral form.
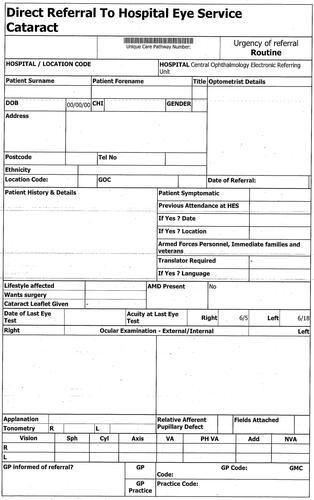
Figure 2 Post-operative visual acuity outcomes for QMH department (all surgeons) compared to Doctor X.
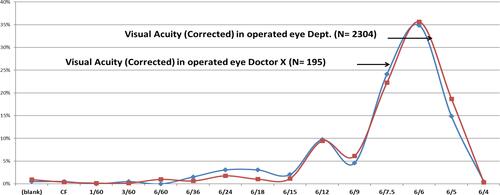
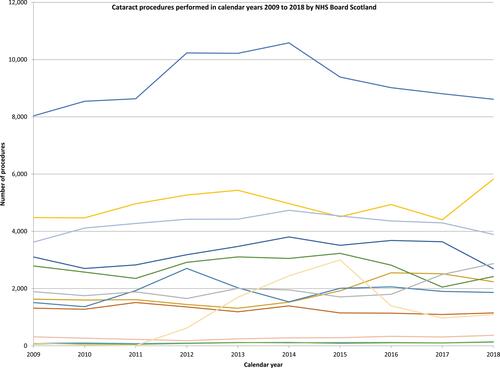
Figure 3 Cataract surgery procedures performed in calendar years 2009 to 2018 by NHS Board in Scotland, United Kingdom. From: Scottish Government. National Ophthalmology Workstream: Hospital Eye Services Progress, Priorities & Practical Actions for a Safe, Sustainable Service across Scotland April 2017.Citation18 Accessible at: https://www.nhshighland.scot.nhs.uk/Services/Optometry/Documents/SGHD%20National%20Ophthalmology%20Workstreams%20HES%20April%202017.pdf.