Figures & data
Figure 1 Infrared autofluorescence fundus photograph of age-related geographic atrophy at presentation (A), at the time of initial panmacular SDM treatment 7 months later (B), and at the last visit 34 months following initiation of panmacular SDM treatment (C).
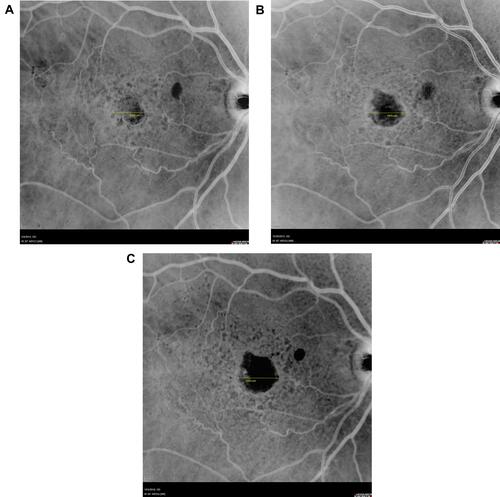
Figure 2 Infrared autofluorescence fundus photograph of age-related geographic atrophy at presentation (A), at the time of initial panmacular SDM treatment 51 months later (B), and at the last visit 43 months following initiation of panmacular SDM treatment (C).
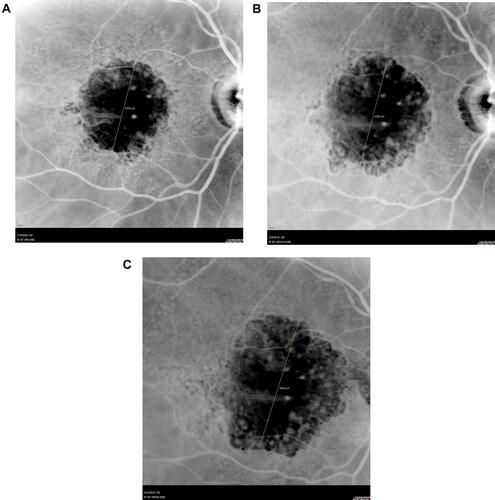
Figure 3 Distribution of geographic atrophy diameters at presentation; on date of last images prior to treatment; on date of fist panmacular SDM treatment; and at last visit following institution of regular periodic panmacular SDM treatment.
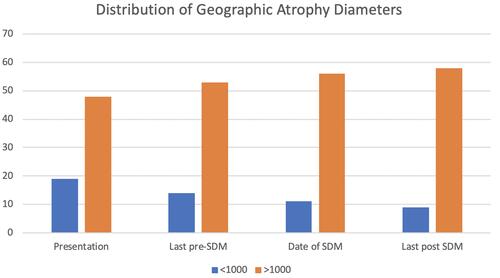
Figure 4 Boxplots showing the distribution of logMAR visual acuity (VA) over time, including at presentation, at time of treatment, and at final follow-up post treatment. Boxplots display the mean (black dot), median (line within the box), interquartile range (IQR) including the 25th percentile (bottom of the box) and 75th percentile (top of the box), observations within 1.5 times the IQR (upper and lower fences), and outliers (asterisks, observations outside 1.5 times the IQR). Despite slowing of progression following treatment, visual acuities diminish over the 4.7 year (avg.) observation period due to increasing incidence and degree of foveal involvement.
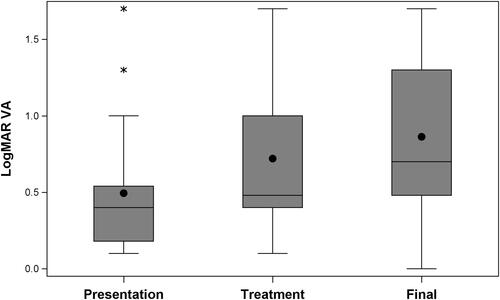
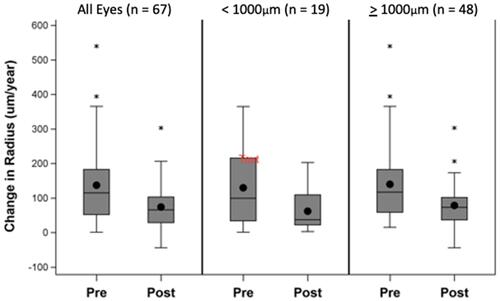
Figure 5 Boxplots showing the distribution of change in radius, pre and post treatment. Plots are stratified by samples of all eyes (n=67), eyes with initial diameter <1000µm (n=19) and eyes with initial diameter >1000µm (n=48). Boxplots display the mean (black dot), median (line within the box), interquartile range (IQR) including the 25th percentile (bottom of the box) and 75th percentile (top of the box), observations within 1.5 times the IQR (upper and lower fences), and outliers (asterisks, observations outside 1.5 times the IQR). For each comparison panmacular SDM laser significantly reduced the annual rate of linear radial progression of geographic atrophy (p<0.0001, linear regression analysis). A linear mixed model accounting for inter-eye correlation was performed to test the potential difference between eyes with smaller (≤ 1000um) vs larger (>1000um) initial lesion diameters. Initial lesion size did not significantly affect rates of progression either before after SDM treatment (pre-treatment continuous measure (p = 0.919), dichotomized scale (p = 0.824); post treatment continuous measure (p = 0.408), dichotomized scale (p = 0.269).