Figures & data
Table 1 Baseline Demographics
Figure 1 Change from screening in best-corrected visual acuity (BCVA) at each study visit for the (A) ranibizumab 0.5mg (white circle) vs ranibizumab 2.0mg (black circle), (B) treatment naïve (white circle) vs previously treated (black circle), and (C) monthly (white circle) vs as needed (PRN) (black circle) cohorts. Statistically significant improvements were noted from screening to 12 months for all studied cohorts (p < 0.05). Comparison of cohorts change at 12 months did not reveal a statistically significant difference between any of the studied cohorts.
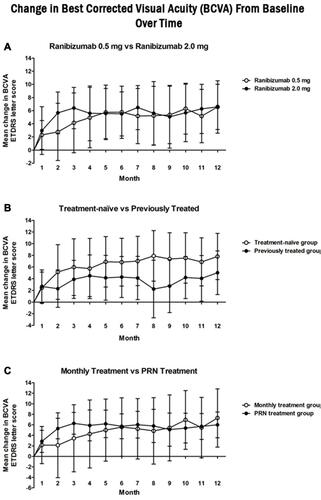
Figure 2 Change from screening in central foveal thickness (CFT) at each study visit for the (A) ranibizumab 0.5mg (white circle) vs ranibizumab 2.0mg (black circle), (B) treatment naïve (white circle) vs previously treated (black circle), and (C) monthly (white circle) vs as needed (PRN) (black circle) cohorts. Statistically significant improvements were noted from screening to 12 months for all studied cohorts (p < 0.05). Comparison of change at 12 months revealed a significantly greater improvement in the treatment-naive cohort compared to the previously treated cohort (p < 0.05). Both the 0.5mg vs 2.0mg and monthly vs PRN cohorts did not have a significant difference in change in CFT at 12 months (p = 0.71 and 0.22, respectively).
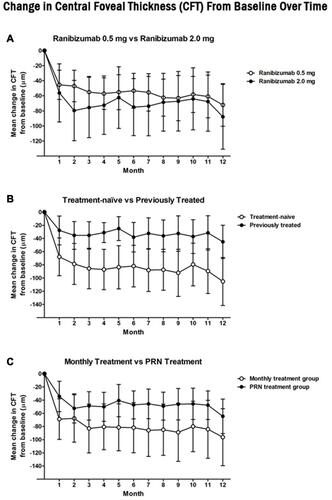
Table 2 Multifocal Electroretinography Cohort Comparisons
Table 3 Lens Status and Multifocal Electroretinography Data
Figure 3 Change in central (A) N1-P1 response density, (B) P1 latency, (C) P1 response density, and (D) N1 response density on multifocal electroretinography at screening (black) vs 12 months (gray) for each studied cohort and all included patients. * Statistically significant change based on paired Student’s t-test (p < 0.05).
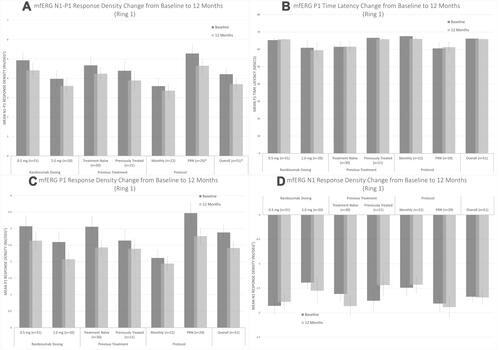
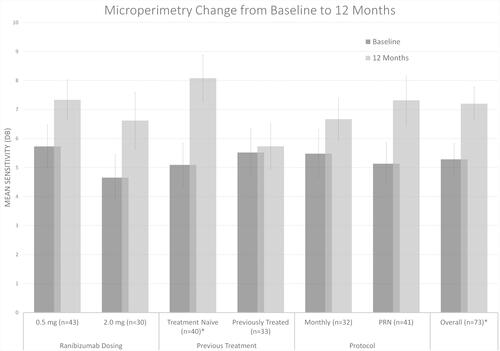
Figure 4 Change in mean sensitivity on microperimetry at screening (black) vs 12-months (gray) for each studied cohort and all included patients. * Statistically significant change based on paired Student’s t-test (p < 0.05).