
Figures & data
Table 1 Demographic and Preoperative Ocular Characteristics
Figure 1 Mean IOP through 24 months postoperative, all eyes (n=340).
Abbreviations: IOP, intraocular pressure; M, month; Preop, preoperative.
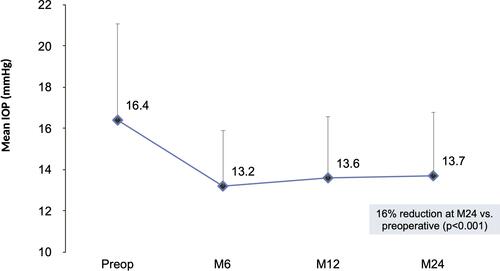
Figure 2 Proportional analysis of IOP at 24 months vs preoperative, all eyes (n=340).
Abbreviations: IOP, intraocular pressure; Preop, preoperative.
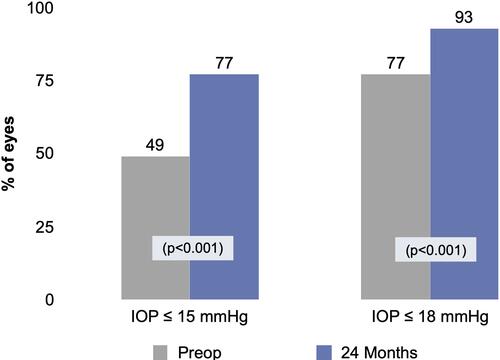
Figure 3 Mean number of medications through 24 months postoperative, all eyes (n=340).
Abbreviations: M, month; Preop, preoperative; Meds, medications.
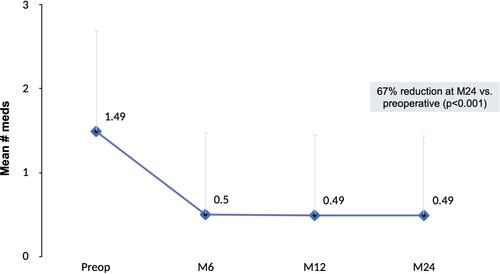
Figure 4 Proportional analysis of medications at 24 months vs preoperative, all eyes (n=340).
Abbreviations: Preop, preoperative; Meds, medications.
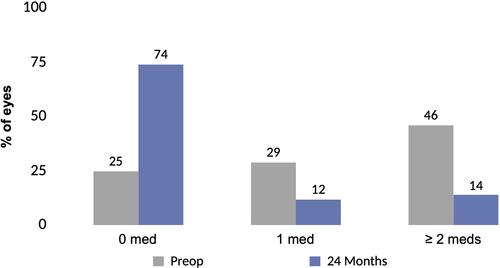
Figure 5 IOP reduction by glaucoma subtype (p<0.01 for all).
Abbreviations: IOP, intraocular pressure; POAG, primary open-angle glaucoma; ACG, appositional angle-closure glaucoma; OHT/GS, ocular hypertension/glaucoma suspect; NTG, normal-tension glaucoma; M, month.
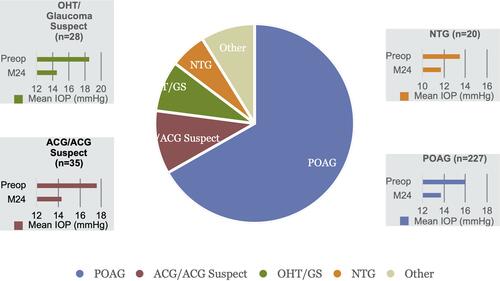
Figure 6 Medication reduction by glaucoma subtype (p<0.001 for all).
Abbreviations: POAG, primary open-angle glaucoma; ACG, appositional angle-closure glaucoma; OHT/GS, ocular hypertension/glaucoma suspect; NTG, normal-tension glaucoma; M, month.
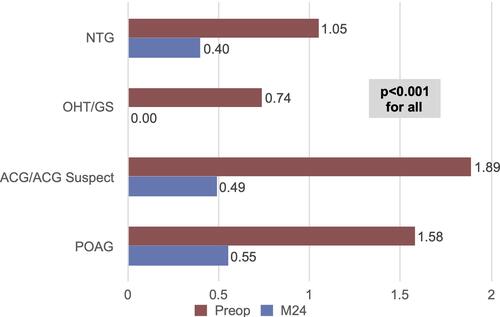
Table 2 Preoperative and Month 24 CDR, VF MD, and CDVA Consistent Sets of Eyes with Data at Both Time Points