Figures & data
Table 1 Patients with CRAO Treated with Intra-Arterial tPA
Figure 1 A histogram demonstrating the number of lines of improvement in Snellen acuity by the frequency of occurrence, for patients treated with intra-arterial tPA for CRAO. Of the eight (53%) eyes that improved by more than three (right of the dotted line), six (75%) improved by five lines or more. Only five (33%) eyes showed no improvement or worsening, while two (13%) improved although by less than three lines.
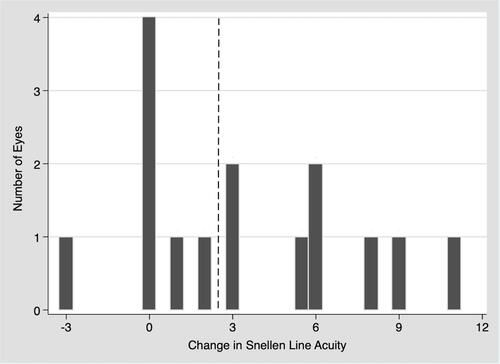
Figure 2 Box plots representing best-corrected visual acuity before and after intervention with intra-arterial tPA for CRAO. In A and B (left), results are from all eyes (n=15) that received intervention. In C and D (right), results are from the subset of eyes (n=8) with improvement of 3 or more lines of Snellen visual acuity improvement, demonstrating the magnitude of visual improvement in cases of successful treatment. Statistical testing was done using logMAR values. ***statistical significance, p<0.05.
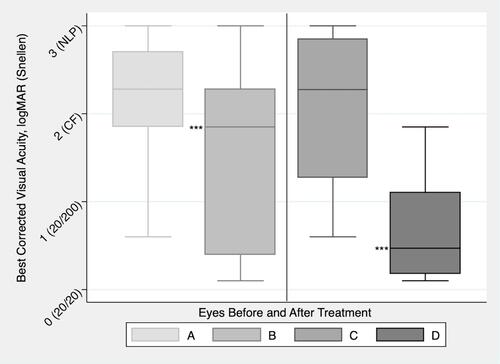
Figure 3 Linear regression analysis of visual acuity at 3-weeks post intervention (y-axis) as a function of visual acuity at initial presentation (x-axis) of eyes treated with intra-arterial tPA for CRAO. Results demonstrate a moderate to high association (r=0.506) with borderline statistical significance (p=0.054).
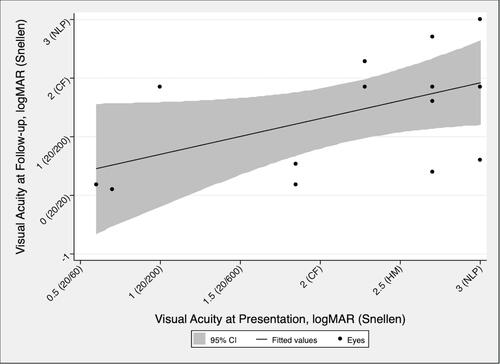
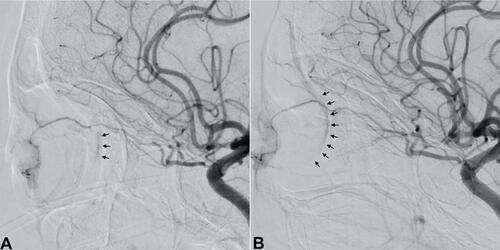
Figure 4 Left internal carotid artery cranial diffusion subtraction angiography images before and after tPA thrombolysis for CRAO. Lateral view shows minimal but present retinal blush (black arrows) before tPA injection (A). After tPA injection, improvement of the retinal blush (black arrows) is observed (B).