Figures & data
Table 1 Preoperative Patient Demographics and Characteristics for All Eyes
Figure 1 IOP reduction in iTrack+phaco and iTrack-alone groups. Mean IOP per group (and SD) at baseline and 12- and 24-month visits is represented with a histogram. The mean IOP value for each group per time-point is depicted at the top of each bar on the graph. In each group, the mean IOP at 12 and 24 months was compared to baseline and * denotes statistically different values (*P<0.001).
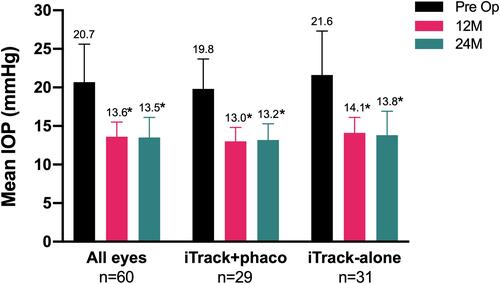
Figure 2 Mean number of medications at baseline, 12 months and 24 months, across the entire cohort, in iTrack+phaco and iTrack-alone groups. The mean number of glaucoma medications used per eye (and SD) is represented with a histogram. The mean value per group at each time point is shown at the top of each bar. In each group, there is a statistically significant decrease in number of medications used at 12 and 24 months when compared to baseline (*P<0.001).
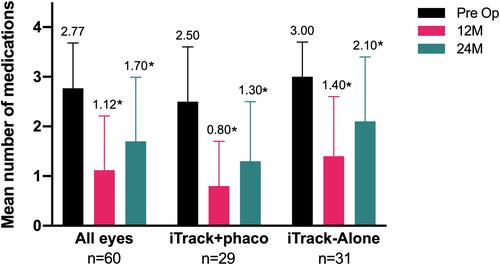
Figure 3 Stability and effectiveness of IOP reduction at 24 months postoperative in the iTrack +phaco and iTrack-alone groups. The distribution of the extent of IOP reduction from baseline (%) is represented in this figure (n=29 eyes an n=31 eyes in iTrack+phaco and iTrack-alone groups, respectively).
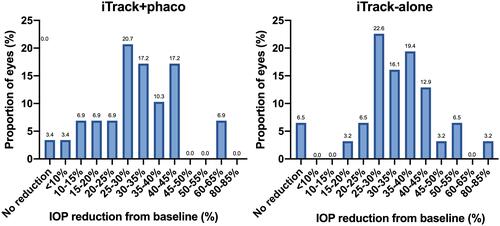
Figure 4 Proportion of eyes per number of medications. The proportion of eyes (%) per number of medications in each group (iTrack+phaco n=29 and iTrack-alone n=31) at baseline, 12 months and 24 months is depicted.
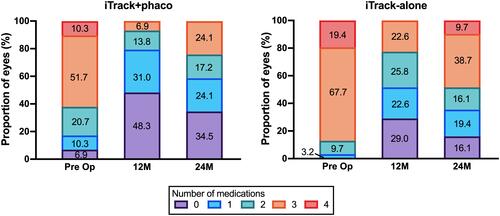
Table 2 Reduction in IOP and Number of Medications According to Glaucoma Severity
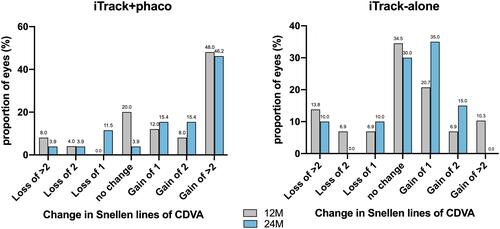
Table 3 Corrected Visual Acuity at Baseline and at the Follow-Up Visits
Figure 5 Visual acuity. For each group, corrected distance visual acuity is represented as loss or gain of lines of Snellen at the 12- and 24-month follow-up visits, compared to baseline. Visual acuity data at 12 months were available for n=25 eyes in the iTrack+phaco group and n=29 in the iTrack-alone group. At 24 months, values were available for n=26 eyes in the iTrack+phaco group and n=20 in the iTrack-alone group.