
Figures & data
Figure 1 MB uptake of HCEC. (A) Some cells stain blue (oxidized MB) in a 48 h confluent HCEC monolayer after 30 min incubation with 1% MB. (Bar = 50µm). (B) Time and MB concentration-dependent uptake by HCEC (OD620 of the cell lysate).
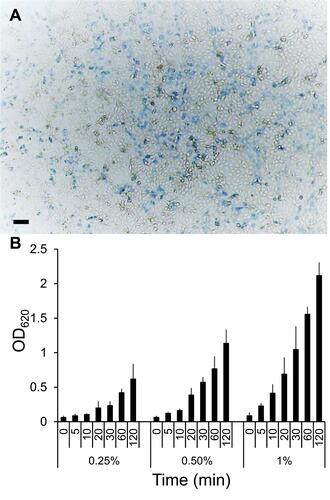
Figure 2 MB concentration-dependent inhibition of AHC viruses. Pre-treated of HCEC cultures for 30 min with different concentrations of MB resulted in dose-dependent inhibition of (A) 5 E70 and (B) 3 CA24v production. [Each point is the mean calculated Log10 PFU/mL inhibition for each virus isolate in 3 parallel HCEC experiments assayed in duplicate. Mean virus yield inhibitions of ≥1.0 Log10 PFU/mL are high significant; P’s<0.01.]
![Figure 2 MB concentration-dependent inhibition of AHC viruses. Pre-treated of HCEC cultures for 30 min with different concentrations of MB resulted in dose-dependent inhibition of (A) 5 E70 and (B) 3 CA24v production. [Each point is the mean calculated Log10 PFU/mL inhibition for each virus isolate in 3 parallel HCEC experiments assayed in duplicate. Mean virus yield inhibitions of ≥1.0 Log10 PFU/mL are high significant; P’s<0.01.]](/cms/asset/8272f09a-ecde-459c-b3ea-fc05ff9642df/doph_a_12176964_f0002_b.jpg)
Figure 3 MB inhibition of AHC virus production, caspase-3-mediated cell death with DNA fragmentation. (A) Virus production in E70 and CA24v infected MB treated and untreated (VC) HCEC at times post infection [Mean Log10 PFU/mL ±SEM from 3 experiments assayed in duplicate]. (B) MB inhibition of caspase-3 activation in E70 and CA24v infected HCEC at times post infection. [Mean (±S.D.) caspase-3 levels (units/mL) from replicate experiments assayed in duplicate]. (C) A representative agarose gel showing (inverted image) the ethidium bromide-binding polymeric DNA fragments extracted from E70 and CA24v infected HCEC. (D) Mean densitometric quantification of the 300bp DNA bands (boxed area) from 3 experiments.
![Figure 3 MB inhibition of AHC virus production, caspase-3-mediated cell death with DNA fragmentation. (A) Virus production in E70 and CA24v infected MB treated and untreated (VC) HCEC at times post infection [Mean Log10 PFU/mL ±SEM from 3 experiments assayed in duplicate]. (B) MB inhibition of caspase-3 activation in E70 and CA24v infected HCEC at times post infection. [Mean (±S.D.) caspase-3 levels (units/mL) from replicate experiments assayed in duplicate]. (C) A representative agarose gel showing (inverted image) the ethidium bromide-binding polymeric DNA fragments extracted from E70 and CA24v infected HCEC. (D) Mean densitometric quantification of the 300bp DNA bands (boxed area) from 3 experiments.](/cms/asset/4019b60c-f836-4ea5-8d0b-59cae2dd2668/doph_a_12176964_f0003_b.jpg)
Figure 4 MB applied post AHC virus infection. (A) Oxidized BM (blue) in 24 h confluent monolayer incubated with 0.5% MB for 30 min (control) and (B) oxidized MB associated with 2 niduses of E70 infected HCEC. (C) Higher magnification showing differential MB staining within a nidus of E70 infected cells. Note several blue to colorless (arrows) HCEC within the nidus of viral cytopathology (Bar=50µm). (D) Virus yields after 24 h incubation from HCEC cultures infected with 300 PFU E70 or 1000 PFU CA24v and treated 30 min with 0.5% MB at times post infection. [Mean Log10 PFU/mL (±SEM) from 2 experiments assayed in duplicate (*p’s≤0.01; **p≤0.001)]. (E) Representative agarose gel of 2 experiments showing the polymeric DNA fragment profiles extracted from HCEC treated with MB at times post E70 or CA24v infection. (F) Mean grey scale density of the 300bp DNA (boxed area) bands in 2 agarose gels showing reduced virus-induced polymeric DNA fragment levels up to 6 h post MB treatment.
![Figure 4 MB applied post AHC virus infection. (A) Oxidized BM (blue) in 24 h confluent monolayer incubated with 0.5% MB for 30 min (control) and (B) oxidized MB associated with 2 niduses of E70 infected HCEC. (C) Higher magnification showing differential MB staining within a nidus of E70 infected cells. Note several blue to colorless (arrows) HCEC within the nidus of viral cytopathology (Bar=50µm). (D) Virus yields after 24 h incubation from HCEC cultures infected with 300 PFU E70 or 1000 PFU CA24v and treated 30 min with 0.5% MB at times post infection. [Mean Log10 PFU/mL (±SEM) from 2 experiments assayed in duplicate (*p’s≤0.01; **p≤0.001)]. (E) Representative agarose gel of 2 experiments showing the polymeric DNA fragment profiles extracted from HCEC treated with MB at times post E70 or CA24v infection. (F) Mean grey scale density of the 300bp DNA (boxed area) bands in 2 agarose gels showing reduced virus-induced polymeric DNA fragment levels up to 6 h post MB treatment.](/cms/asset/239556c2-809c-435c-87dc-f211d9c581aa/doph_a_12176964_f0004_c.jpg)