Figures & data
Figure 1 Visual acuity (VA) outcomes of intravitreal anti-VEGF therapy for nAMD at baseline and 1 year. Only real-world studies with ≥100 eyes at baseline are included. The year of publication is later than the date of acquisition of data for all studies. Blue indicates ranibizumab treated eyes. Orange indicates aflibercept treated eyes. Grey indicates that combined data for ranibizumab and aflibercept treated eyes was reported. Green indicates mean visual gain from baseline. Red indicates mean visual loss from baseline.
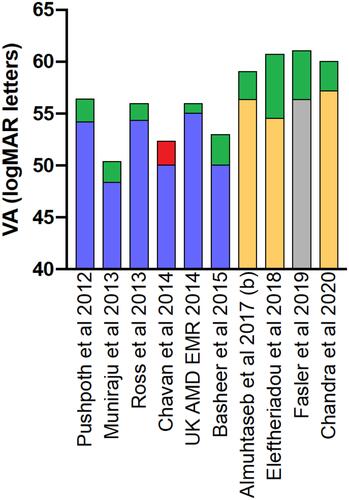
Figure 2 Visual acuity (VA) outcomes of intravitreal anti-VEGF therapy for nAMD at baseline and 2 years. Only real-world studies with ≥100 eyes at baseline are included. The year of publication is later than the date of acquisition of data for all studies. Blue indicates ranibizumab treated eyes. Orange indicates aflibercept treated eyes. Green indicates mean visual gain from baseline. Red indicates mean visual loss from baseline.
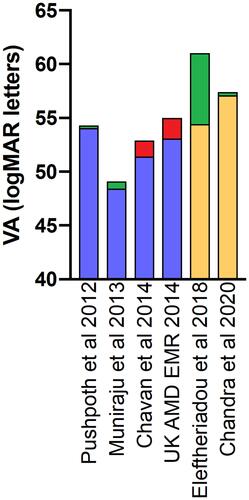
Table 1 Percentage of Eyes Losing >15 Letters from Baseline VA
Table 2 Percentage of Eyes with Driving Level VA at Baseline and 1 and 2-Year Follow-Up
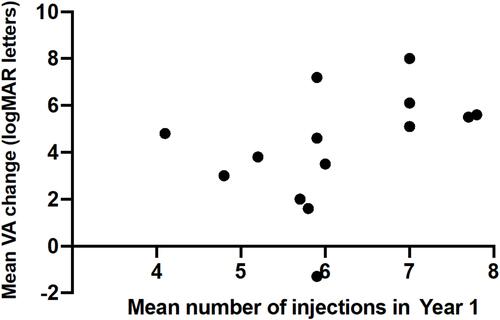
Figure 3 Mean VA gain at 1 year correlated with mean number of intravitreal anti-VEGF injections received. Only real-world studies with ≥100 eyes at baseline were included. It should be noted that a limitation is that there will be variation in baseline characteristics of included studies. Pearson correlation coefficient, r = 0.66 (p = 0.0095) indicating moderate positive correlation that is statistically significant.