
Figures & data
Table 1 Grading Schemes for Uveitis According to SUN and the National Eye Instiute Criteria
Table 2 Basic Characteristics and Serum Endothelin-1 Concentration in Children and Adolescents with Idiopathic Uveitis and Control Group
Figure 1 Box and whisker plots and scatter plots of serum endothelin-1 concentrations in control group and chronic idiopathic uveitis. Boxes represent the interquartile range (25th–75th percentiles), the point in the box represents the median, and the whiskers extend to the most extreme data points (range).
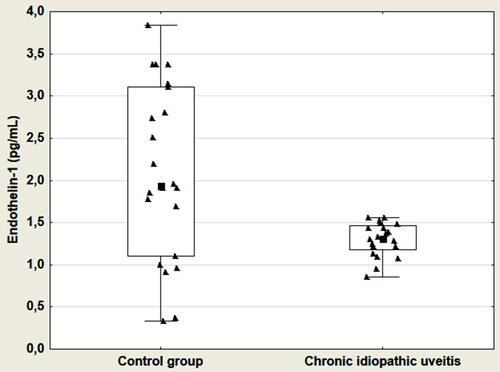
Table 3 Characteristics of Chronic Idiopathic Uveitis Patients and the Grades of Inflammation According to SUN Criteria
Table 4 Concentrations of Endothelin-1 Depending on the Grade of Inflammation