Figures & data
Table 1 Biometry and Refractive Summary (n = 39 Subjects, 78 Eyes)
Figure 1 Binocular uncorrected visual acuity at distance, intermediate and near (n = 39).
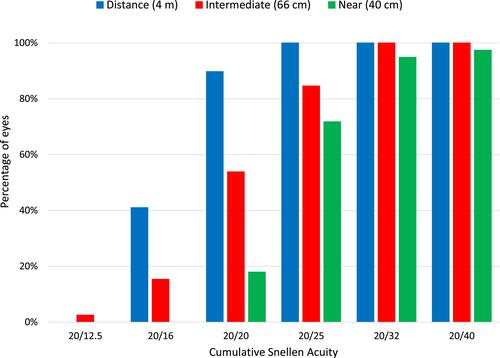
Figure 2 Binocular best distance-corrected visual acuity at distance, intermediate and near (n = 39).
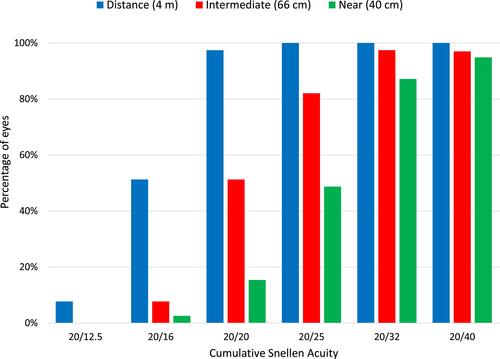
Figure 3 Mean binocular defocus curve.
Abbreviations: D, diopters; logMAR, log of the minimum angle of resolution.
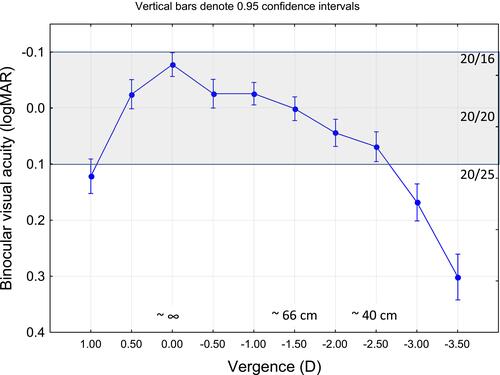
Figure 4 Reading speed based on reading acuity.
Abbreviations: logRAD, log of the reading acuity determination.
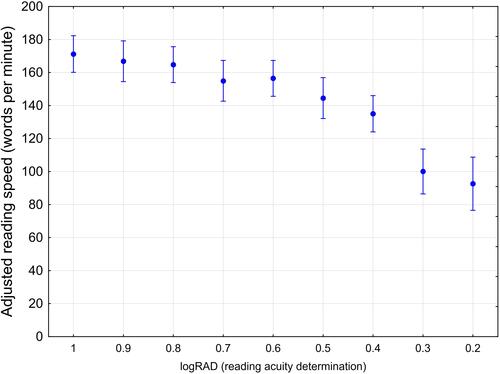
Figure 5 Reported percentage of spectacle wear by viewing distance and time.
Abbreviations: 1M, 1 month, 3M, 3 months.
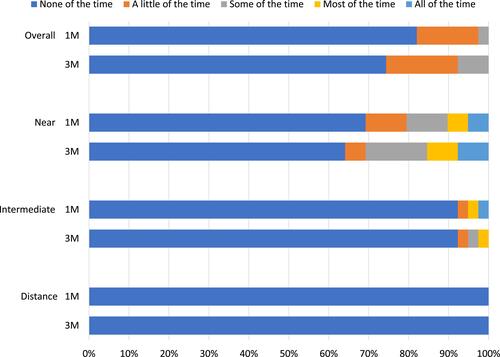
Figure 6 Reported ability to function without glasses by time point and viewing distances.
Abbreviations: 1M, 1 month; 3M, 3 months.
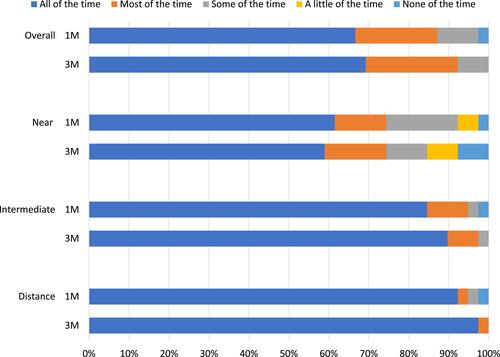
Figure 7 Satisfaction with vision over time and viewing distance.
Abbreviations: 1M, 1 month; 3M, 3 months.
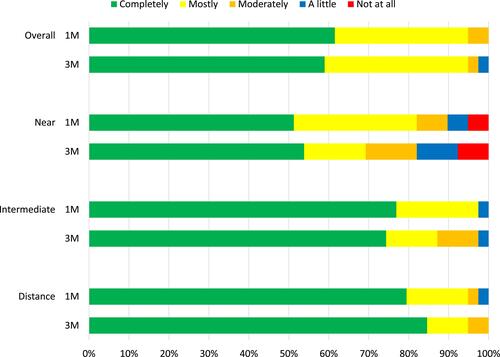
Figure 8 Reported frequency of visual disturbances at 1 and 3 months.
Abbreviations: 1M, 1 month; 3M, 3 months.
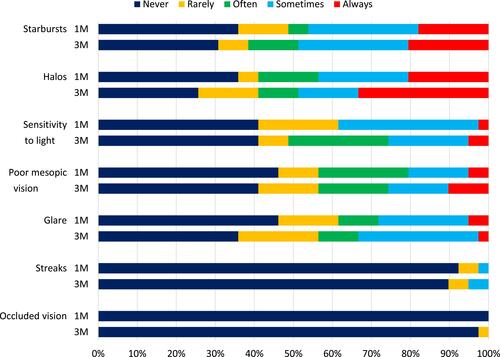
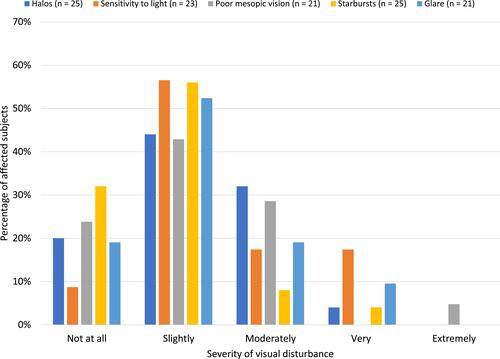
Figure 9 Severity of reported visual disturbances at 3 months, when reported.