Figures & data
Table 1 Operating Room Milestones Observed in This Study and Their Corresponding DefinitionsCitation9,Citation15
Table 2 Efficiency Parameters That Were Calculated from the Operating Room Milestones with Their Corresponding Equations and DefinitionsCitation9,Citation15,Citation18
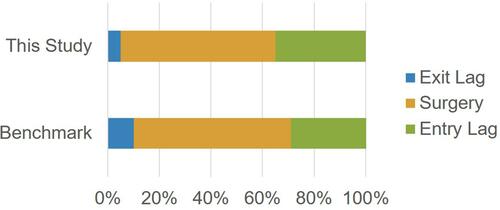
Figure 1 Schematic of the different operating room milestones and key performance parameters.
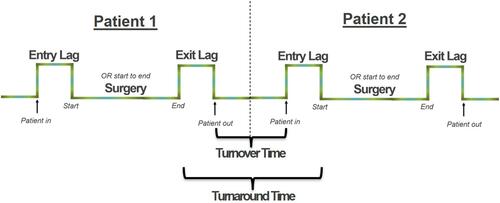
Table 3 Key Performance Indicators Obtained for This Study and Compared with Internationally Published Proposed Targets and Benchmark DataCitation11,Citation18
Table 4 In-Room Segment Analysis Containing Equation for Data Source, Results (in Percent) and Comparison to Benchmark Data Specific for Cataract SurgeriesCitation18
Figure 2 Segment analysis showing percentage of time spent for entry lag, the operation, and exit lag. Results of this study are compared with benchmarks for cataract surgery.