Figures & data
Figure 1 (A) Coronal contrast-enhanced T1-weighted orbital magnetic resonance imaging with fat suppression (CE-T1W/FS) in a patient with myasthenia gravis. (B) Coronal orbital computerized tomography scan in a patient with myasthenia gravis. The thickest part of bilateral inferior rectus muscles was measured (white line) in both cases.
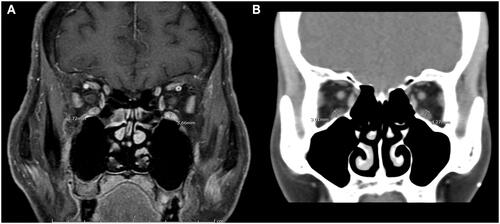
Table 1 Mean Muscle Thickness of Each Muscle in the Myasthenia Gravis and Control Groups in All Participants
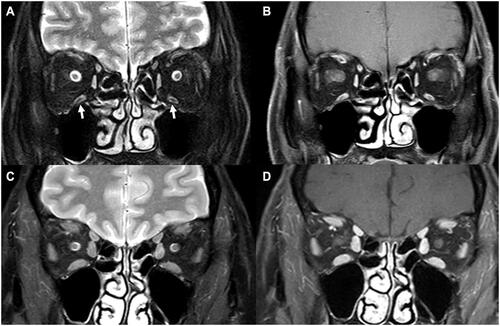
Figure 2 Graph of the correlation between the sum of muscle thickness (mm) and disease duration (years) in the myasthenia gravis group.
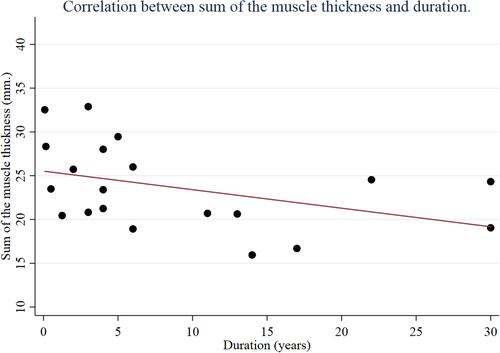
Table 2 Mean Muscle Thickness of Each Muscle in the Myasthenia Gravis and Control Groups in Participants with MRI Scans
Figure 3 (A) Coronal T2-weighted orbital magnetic resonance imaging with fat suppression (T2W/FS) and (B) coronal CE-T1W/FS in a 49-year-old woman with myasthenia gravis for 10 years, showing bilateral extraocular muscle (EOM) atrophy and isointensity with central hypointensity of bilateral inferior rectus muscles (arrow); (C) Coronal T2W/FS and (D) coronal CE-T1W/FS in a control participant, showing normal EOM size and isointense muscles.