Figures & data

Figure 1 This image illustrates some of the sitemap readouts on a specific case: (A) shows an overview of wavefront refraction @ 4mm pupillary zone on the top and wavefront map on the left and tomography map on the right, (B) the axial length interferometry measurements that are actually used as an initial step in order to create the customized “model” eye for the ray tracing calculations that follow, (C) illustrates a comparative overview of the tomography maps and (D) those of the wavefront.
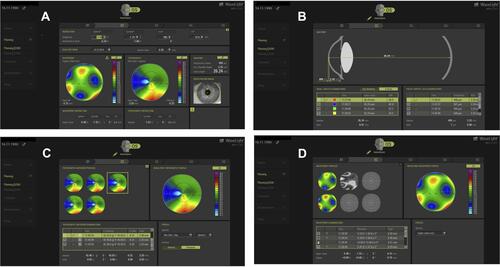
Figure 2 Customized treatment profile employed in the Innoveyes treatment for the same eye noted in. , as illustrated by the EX500 excimer laser treatment Innoveyes software. The software overview of the suggested treatment following the noted ray tracing calculations in the case described in .
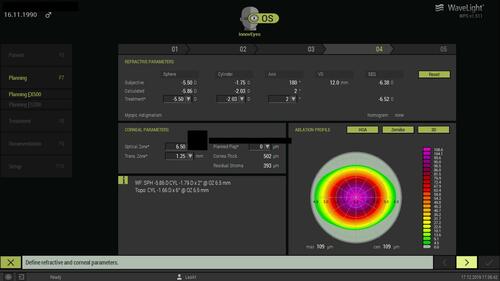
Figure 3 Cumulative outcome data in graphs: UDVA=uncorrected distance visual acuity, CDVA=corrected distance visual acuity, SE=spherical equivalent. Top left image (A) demonstrates the pre-operative CDVA plotted with the postoperative UDVA, the top right image (B) demonstrates the change in CDVA pre- to post-op, the middle left image (C) demonstrates the attempted vs achieved spherical equivalent refractive error scatter and r2 relationship between them. The middle right image (D) demonstrates the postoperative spherical equivalent refraction in Diopters. The bottom left image (E) demonstrates the change in refractive astigmatism values in diopters from pre=op to post-op, and last the bottom right image (F) demonstrates the stability of spherical equivalent refraction from pre- to 1 week, 1 month and 6 month intervals.
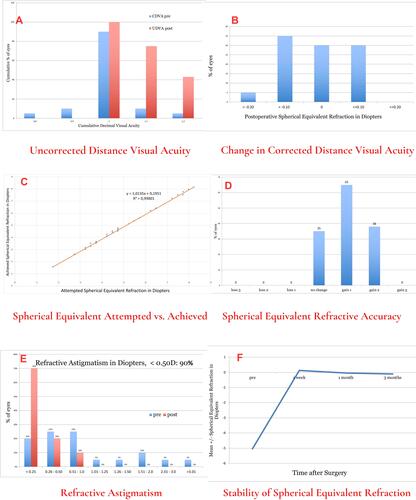
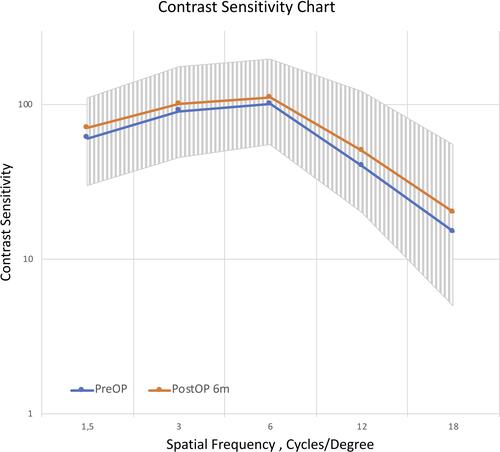
Figure 4 This image illustrates the contrast sensitivity measured in several cycles/degree points preoperative and at 6 months postoperative. It appears improved when measured postoperatively as an average in all cycles/degree points measured.