
Figures & data
Table 1 Demographics, Preoperative Refractive Status and Follow-Up Time
Table 2 Clinical Outcomes (n = 133 Manifest, 115 PAE)
Figure 1 Postoperative uncorrected visual acuity by group.
Abbreviation: PAE, Phorcides Analytical Engine.
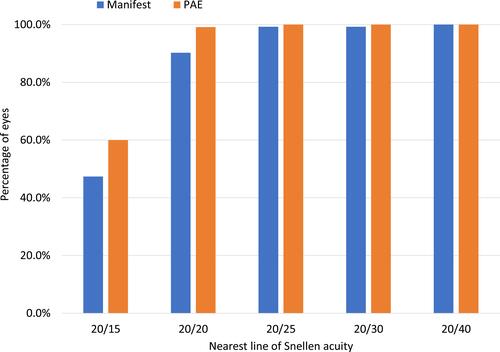
Figure 2 Postoperative best-corrected visual acuity by group.
Abbreviation: PAE, Phorcides Analytical Engine.
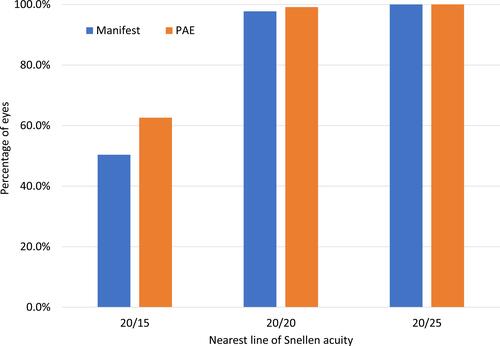
Figure 3 Residual refractive cylinder by group.
Abbreviation: PAE, Phorcides Analytical Engine.
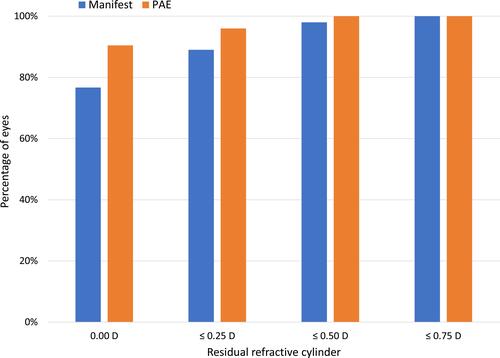
Table 3 Difference Between Preoperative CDVA and Postoperative UDVA and CDVA