Figures & data
Table 1 Comparison of the Right and Left Eyes
Table 2 Intrasession Variability of Intraocular Pressure (mmHg) Measured at Least Thrice with a Noncontact Tonometer
Figure 1 Intraocular pressure (IOP) in the left eye, measured for 5 consecutive days with a noncontact tonometer. In the one-way repeated-measures analysis of variance, IOP was significantly lower on day 1 than on days 2 to 5 in the left eyes. *P < 0.05, **P < 0.01, ***P < 0.001.
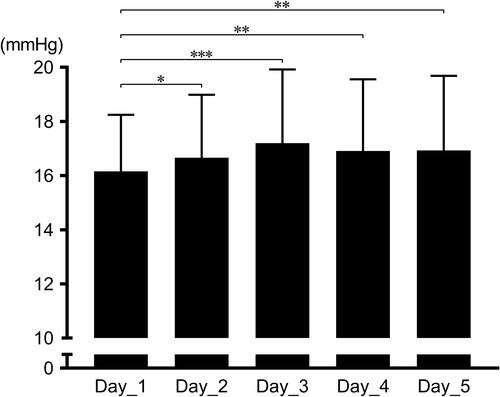
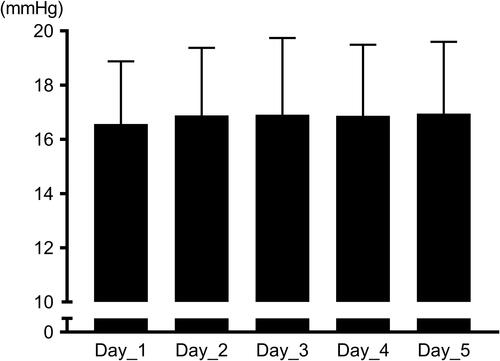
Figure 2 Intraocular pressure (IOP) in the right eye, measured for 5 consecutive days with a noncontact tonometer. In the one-way repeated-measures analysis of variance, there were no significant differences among IOP values measured on days 1 to 5 in the right eyes.