
Figures & data
Figure 1 Subject 1: The first column shows the same dynamic meibomian images prior to VTP treatment with the total area analyzed (A1, red outline), the area of meibomian gland atrophy + interglandular space (B1, green outline), and (A1, B1) superimposed (C1). The second column shows the same dynamic meibomian images after VTP treatment in the same patient as the first column. (A2) indicates the total area analyzed (red outline), (B2) indicates the area of meibomian gland atrophy + interglandular space (green outline), and (C2) shows (A2, B2) superimposed.
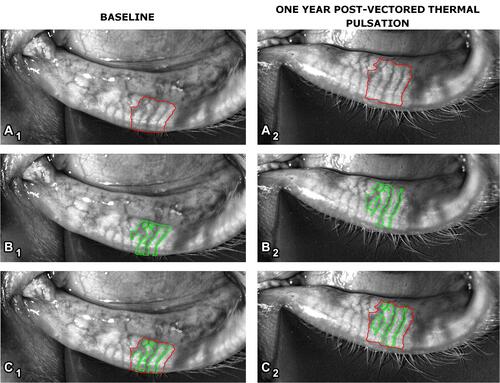
Figure 2 Subject 2: The first column shows the same dynamic meibomian images prior to VTP treatment with the total area analyzed (A1, red outline), the area of meibomian gland atrophy + interglandular space (B1, green outline), and (A1, B1) superimposed (C1). The second column shows the same dynamic meibomian images after VTP treatment in the same patient as the first column. (A2) indicates the total area analyzed (red outline), (B2) indicates the area of meibomian gland atrophy + interglandular space (green outline), and (C2) shows (A2, B2) superimposed.
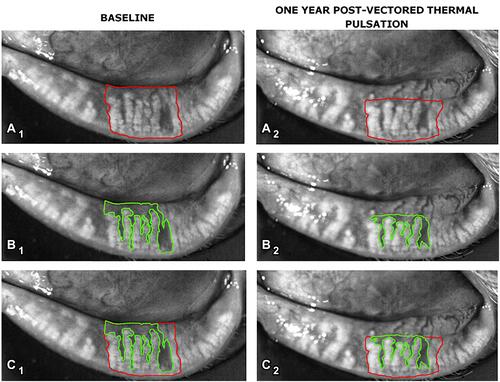
Table 1 Results from Morphometric Meibomian Gland Pixelar Analysis of Dynamic Meibomian Imaging for Treatment and Control Groups
Table 2 Statistical Analysis of Dry Eye Disease Markers for Treatment and Control Groups