Figures & data
Figure 1 Contoura planning of the manifest refraction correction (group A).
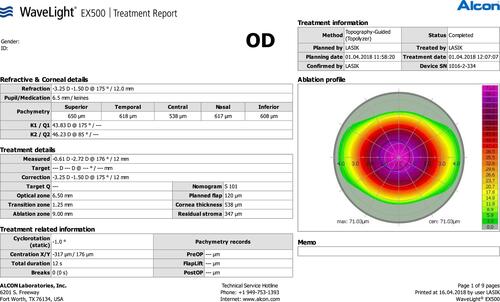
Figure 2 Contoura planning of the full topography modified refraction correction (group B).
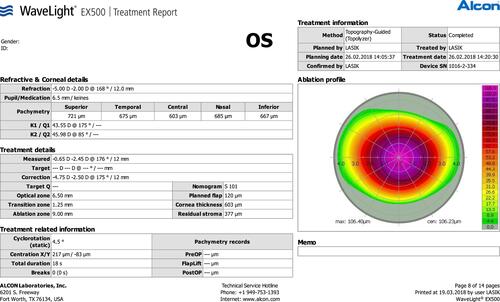
Table 1 Preoperative Refractive Variables
Table 2 Postoperative Refractive Variables
Figure 3 (A) Comparison between the mean postoperative UDVA in the three groups. (B) The cumulative postoperative UDVA in the three groups in logMAR. (C) The mean preoperative and postoperative vision in group (A). (D) The mean preoperative and postoperative vision in group (B). (E) The mean preoperative and postoperative vision in group (C).
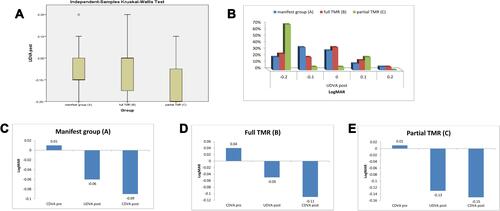
Figure 4 (A) The residual postoperative spherical equivalent in the three groups. (B) The residual anterior corneal astigmatism of the three groups. (C) The postoperative line gain in the three groups. (D) The cumulative postoperative CDVA in the three groups in logMAR.
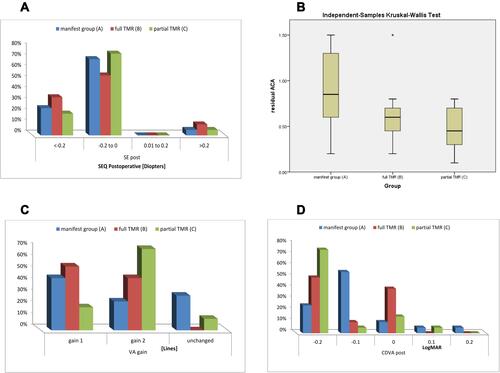
Table 3 Vector Analysis
Figure 5 Single-angle polar plots generated using the ASSORT software to illustrate the target induced astigmatism (TIA) vector, the surgically induced astigmatism (SIA) vector, the difference vector (DV), and the correction index (CI) in the manifest group (A) vs full TMR group (B) and partial TMR group (C). The vector means are plotted as a red diamond.
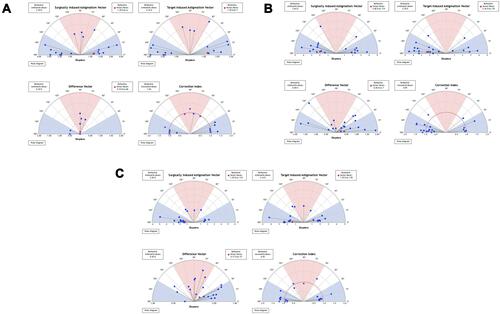
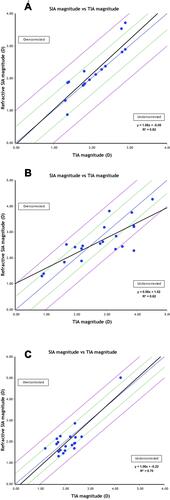
Figure 6 Target induced astigmatism (TIA) vector vs surgically induced astigmatism (SIA) vector (calculated at the corneal plane) of the manifest group (A), the full TMR group (B), and the partial TMR group (C).