
Figures & data
Table 1 Patient Demographic and DED Data at Day 01 (Mean Values)
Figure 1 Mean results for central precorneal tear film thickness, fluorescein tear breakup time, Schirmer test, ocular surface disease index and corneal grading at Day 0 and Day 15. *p=0.000015, **p=0.0003, ***p=0.009, ****p=0.03, *****p=0.002, ******p=0.001.
Abbreviations: CPTFT, central precorneal tear film thickness; FTBUT, fluorescein tear breakup time; OSDI, ocular surface disease index; corneal grading staining done by Oxford schema; sec, second.
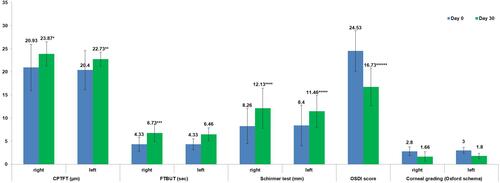
Figure 2 Mean percent change in tear film thickness between Day 0 and Day 15, according to CPTFT (<24 µm or ≥24 µm) at Day 0. *p=0.004. **p=0.03. ***p=0.02.
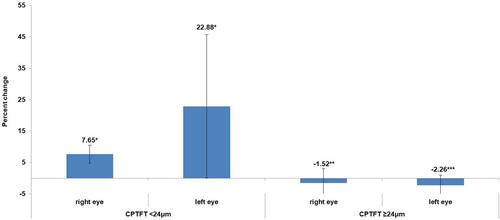
Table 2 Correlation Coefficients of Percentages of Change in Tear Film Thickness Between the Different Tests, and p-values