
Figures & data
Figure 1 Optical coherence tomography (OCT) and OCT angiography (OCTA) images of the retinal vascular capillary plexus layers and macular zones on the ETDRS map. (A–C) Cross-sectional B-scan OCT images showing segmentation of the various retinal plexus layer including automated-segmentation of (A) the superficial capillary plexus (SCP; red and green lines outline the border) and (B) deep capillary plexus (DCP; red and green lines outline the border), (C) custom-segmented intermediate capillary plexus (cICP; red and green lines outline the border), and (D) custom-segmented deep capillary plexus (cDCP; two red lines outline the border). (E) An example of a 6x6 mm OCTA image of the DCP showing flow detected on an en face ETDRS map which includes the inner 1 mm circle (“fovea”), inner 3 mm ring and outer 6 mm ring. (F) An example of 3x3 mm OCTA image of the SCP showing flow detected on an enface ETDRS map of the macula, the inner 1 mm circle (ie, “fovea”) and inner 3 mm ring. (Overall ETDRS refers to the total 3 mm circle for the 3x3 mm scan and 6 mm circle for the 6x6 mm scan).
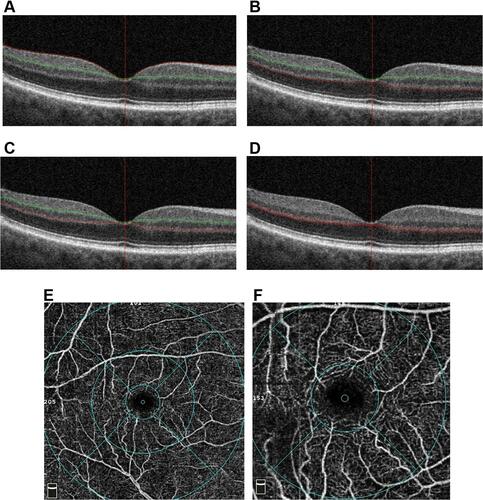
Table 1 Demographics and Clinical Characteristics of the Good Image Cohorts for Each Scan Size and Total Cohort. P-value Shown Compares the Total Cohort to the Good Image Cohort
Table 2 Repeatability of Vascular Density Measurement for the Total Cohort (A, All Enrolled Eyes) and for the Good Image Cohort (B, Subset of Eyes with OCTA Signal Strength ≥6) for the 3x3 mm and 6x6 mm OCTA Scans
Table 3 Repeatability of Macular Vascular Density Measurement Obtained Using OCTA for Eyes with and without CME or Retinal Vasculopathy. (A) 3x3 mm OCTA Scans. (B) 6x6 mm OCTA Scans