
Figures & data
Table 1 Baseline Patient and Ocular Characteristics
Table 2 Clinical Outcomes at One Year
Figure 1 Mean intraocular pressure (top graph) and number of glaucoma medications (bottom graph) between the micropulse laser trabeculoplasty (MLT) and selective laser trabeculoplasty (SLT) groups at follow-up intervals up to 2 years. No statistically significant difference was noted between MLT and SLT-treated eyes except for intraocular pressure at 1 month follow-up. Error bars represent standard error of the mean.
Abbreviation: N, number of eyes.
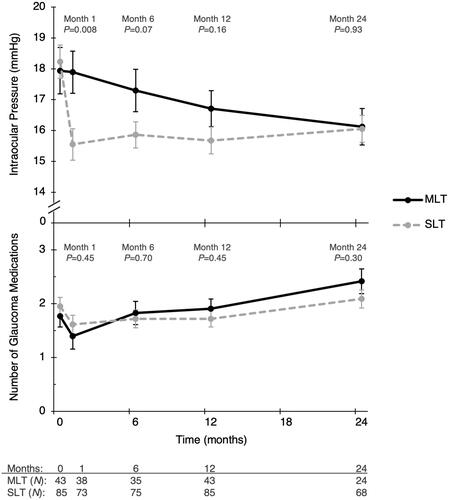
Table 3 Multivariable Regression Model Predicting Success at 1 Year