
Figures & data
Table 1 Visual Acuity, Central Macular Thickness and Different OCTA Parameters at Baseline and Follow-Ups
Figure 1 Shows the SCP with the vessel density and perfusion density at baseline and 1 month after the 3rd injection of a study patient. It shows the superficial capillary plexus: (A) with vessel density calculated at baseline; (B) with vessel density calculated at the end of 3 months (after 3 consecutive injections of anti-VEGF); (C) with perfusion density calculated at baseline; (D) with perfusion density calculated at the end of 3 months (after 3 consecutive injections of anti-VEGF).
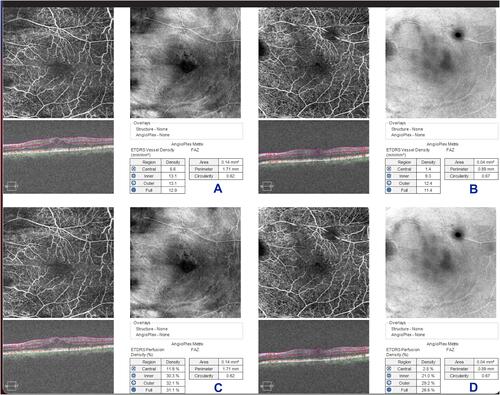
Table 2 Pearson Correlation Between LogMAR, CMT, Area and Perimeter of the FAZ on One Hand and VD and PD on the Other Hand
Table 3 β-Coefficients from a Linear Mixed Model Analysis