Figures & data
Figure 1 Schematic of the clinical study plan.
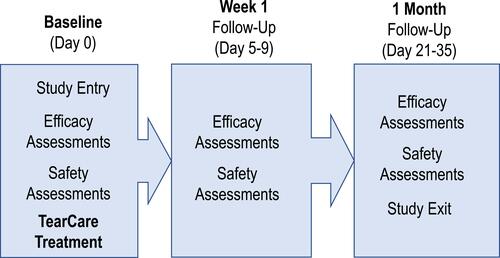
Table 1 Baseline Disease Characteristics
Figure 2 The TearCare System is effective in managing signs and symptoms of MGD and DED. Improvements were seen in (A) TBUT, (B) Meibomian Gland Score, (C) Corneal and Conjunctival Staining, and (D) OSDI scores. * and ** indicate p-values < 0.001.
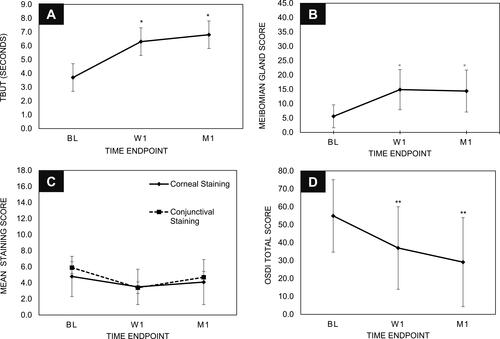
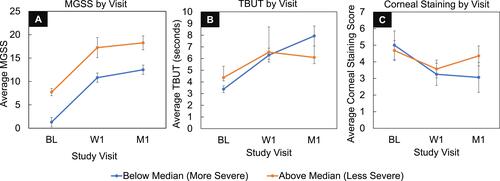
Figure 3 Post-hoc subgroup analyses of the per-protocol population stratified by MGD severity by baseline MGSS scores in the subject’s worst eye (WE) above and below the median. Subjects with more severe dysfunction at baseline (orange) demonstrate a similar treatment effect benefit size in MGSS as subjects with less severe baseline dysfunction (blue) (A) that translates to greater relief of TBUT (B) and corneal staining (C) MGD-related DED signs at 1-month post-procedure. Error bars represent SEM.