
Figures & data
Figure 1 (A and B) Spectacle frames with three attached TM’s. (C and D) Attachment of two TM’s to both inner sides of the spectacle frame located preauricular at the height of the temporal region with direct contact to the skin surface. The third TM was attached to the right outer side of the spectacle frame without having contact to the subjects’ skin surface.
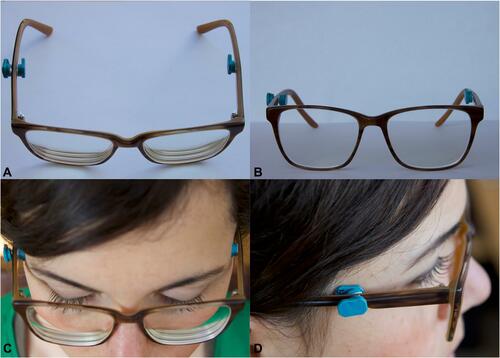
Figure 2 Example of the subjects’ protocol.
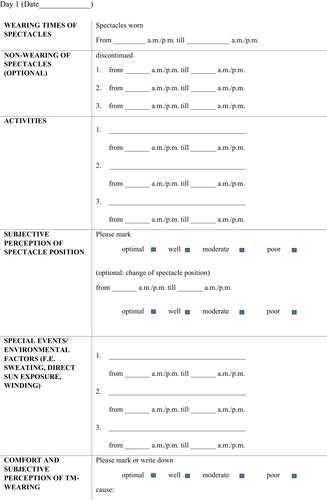
Figure 3 Flow diagram showing spectacle wearing groups and different methods of data analysis.
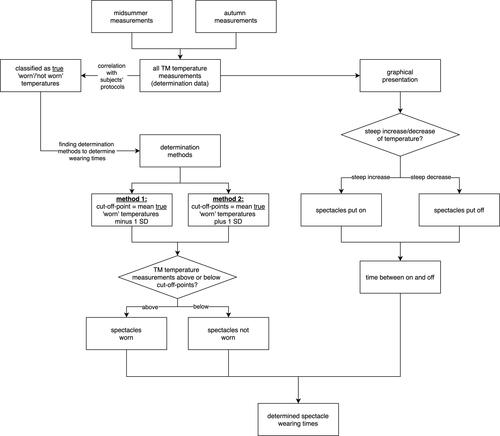
Figure 4 Time plotted temperature measurements of TM’s (°C). The steep increase and decrease of temperatures indicates that spectacles were put on or taken off, respectively. During the wearing times of spectacles temperature oscillates slightly.
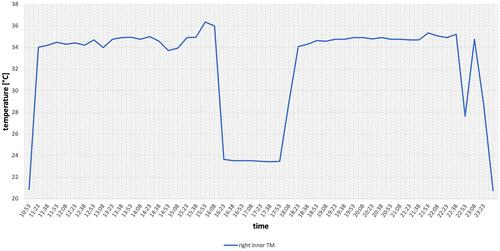
Table 1 Group Means [1 Standard Deviation] of TM Temperatures (°C) Classified by Subjects’ Protocols
Figure 5 Means of determined daily wearing times (hours). (A) Group. (B) Midsummer group. (C) Autumn group.
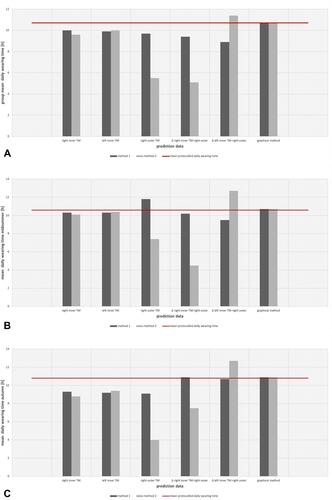
Table 2 Median Percent Error and Median Percent Accuracy [Quartile 1, Quartile 3] of Determined Wearing Times by Different Determination Methods
Figure 6 (A) Time plotted temperatures of both inner and the outer TM’s (°C) exemplary for subject 2. (B) Time plotted temperatures of right inner TM (°C) during protocolled optimal spectacle position and (C) during protocolled poor spectacle position or shifting of spectacles.
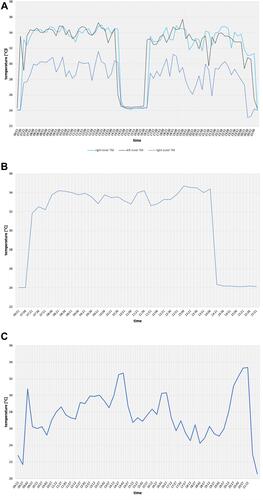
Table 3 Median Percent Error and Median Percent Accuracy [Quartile 1, Quartile 3] of Determined Wearing Times During Reported Poor Spectacle Position by Different Determination Methods.