Figures & data
Table 1 Demographics and Biometry of Study Patients
Figure 1 (A) Construction of tunnel in superior quadrant. (B) Demonstrating Capsulorhexis by 26G bent cystitome. (C) Hydrodissection with balance salt solution under the anterior capsular rim. (D) Prolapse of nucleus into anterior chamber by sinskey hook. (E) Introduction of irrigating vector under the prolapsed nucleus in the anterior chamber. (F) Implantation of intraocular lens in capsular bag.
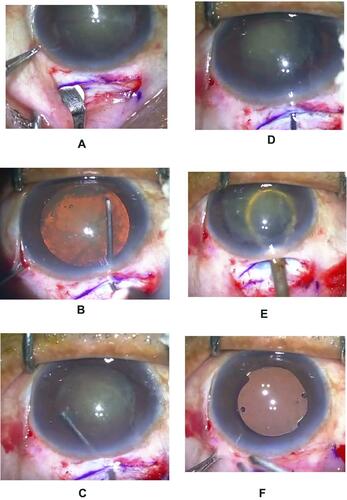
Figure 2 Showing focal corneal edema along paracentral central area POD1.
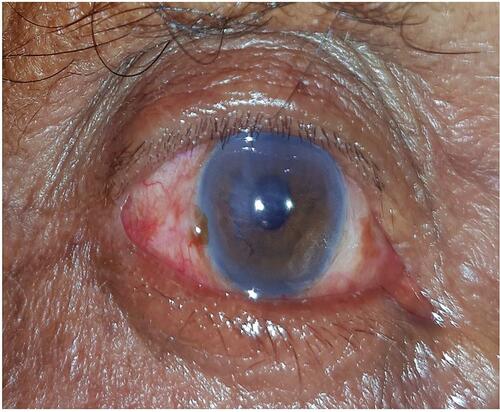
Figure 3 (A) Bar chart showing different grades of nuclear cataract operated. (B) Bar chart demonstrating various adverse events during interoperated period experienced by resident surgeon.
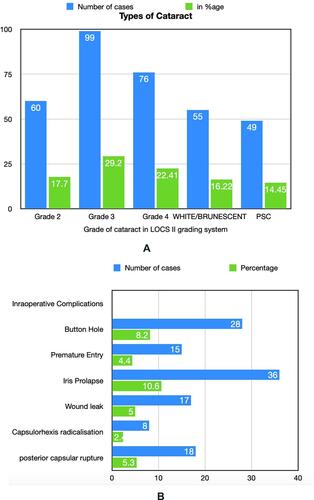
Table 2 Postoperative (POD1) Adverse Events Recorded
Table 3 List of Cases Taken Up for Resurgery
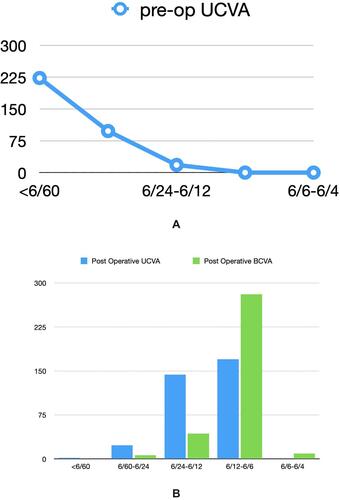
Table 4 Table Showing Preoperative, Postoperative Uncorrected (UCVA) and Postoperative Best Corrected (BCVA) Visual Acuity Interpretation in Logmar Units, Snellen Visual Acuity Chart (20 Feet) and Snellen Visual Acuity Chart (6 Meters)
Figure 4 (A) Line graph illustrating preoperative visual acuity of all 339 study patients. (B) Comparative Line chart exhibiting postoperative uncorrected visual acuity (UCVA) in logmar units and postoperative best corrected visual acuity in logmar units recorded in all 339 study patients.