Figures & data
Table 1 Measures Taken During the COVID-19 Pandemic State Lockdown
Table 2 Demographic Information
Table 3 Chief Complaints
Table 4 Most Common Diagnoses
Table 5 Diagnosis: Category of Eye
Table 6 Office Procedures
Table 7 Surgical Procedure
Table 8 Correlation Between Positive COVID Cases in Detroit and Clinic Visits
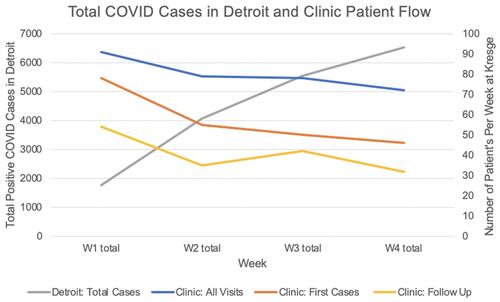
Figure 1 The trend of the total positive COVID case counts in Detroit, Michigan during the period of this study as well as patient flow into Kresge during this time. The grey line shows the total COVID cases in Detroit during the study period. The blue line represents all visits to the clinic per week during the study period. The orange line represents the patient’s first visits during the study period. The yellow line represents all patients presenting for follow-up appointments.