
Figures & data
Table 1 Grade of Severity for Infectious Keratitis
Figure 1 Participants enrollment at Jimma University Medical Center Ophthalmology Department from April 1 to September 30, 2019.
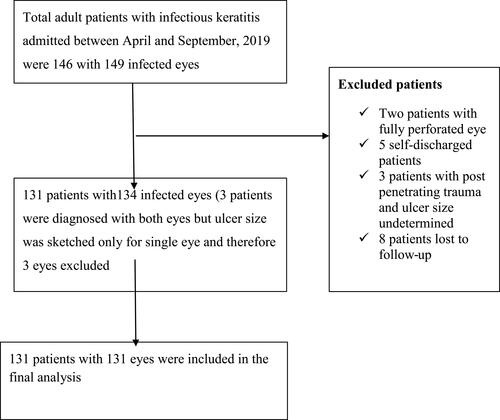
Table 2 Sociodemographic Characteristics of Study Participants Among at JUMCOD from April to September 2019 (n=131)
Table 3 Historical Characteristics of Study Participants at JUMCOD During April to September 2019
Table 4 Characteristics of Ulcer at Admission and Other Objectively Measured Clinical Feature During April to September 2019 (n=131)
Table 5 Key Laboratory and Instrumental Diagnostic Used Among Study Participants at JUMCOD During April to September 2019
Table 6 Drug Susceptibility Test for Isolated Organism Among Study Participants at JUMCOD from April to September 2019
Figure 2 Ocular coorbid disease that were occurred on infectious keratitis patients at JUMCOD from April to September 2019.
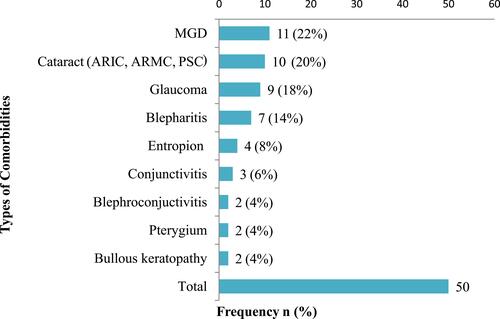
Table 7 Treatment for Infectious Keratitis Patients at JUMCOD from April to September 2019
Table 8 Treatment Outcome of Patients Among Study Participants from April to September 2019 at JUMCOD (n=131)
Figure 3 Surgical treatments for infectious keratitis attending JUMCOD from April to September 2019.
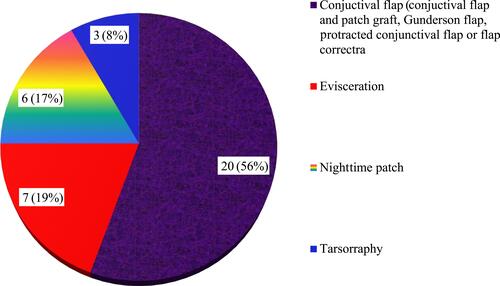
Figure 4 Visual outcome at different time among study participants at JUMCOD from April to September 2019.
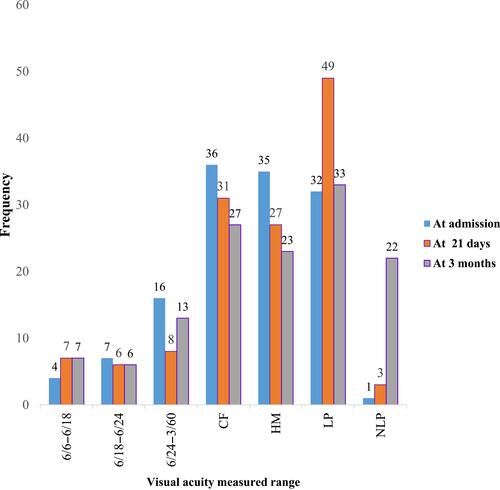
Table 9 Predictors of Poor Treatment Outcome from April to September 2019