
Figures & data
Table 1 Baseline Characteristics of the Studied Patients
Table 2 Preoperative and Postoperative Intraocular Pressure (IOP) Among the Studied Patients
Figure 1 Line graph showing mean IOP among the studied patients preoperatively and postoperatively.
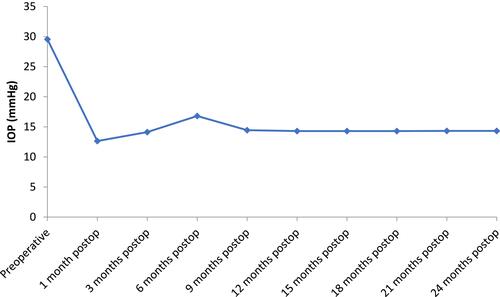
Table 3 Comparison Between Preoperative and Postoperative Number of Medications
Table 4 Correlation/Relation Between Preoperative IOP and the Studied Parameters
Table 5 Distribution of the Studied Patients According to Success Rate
Figure 2 Pie chart showing distribution of the studied patients according to success.
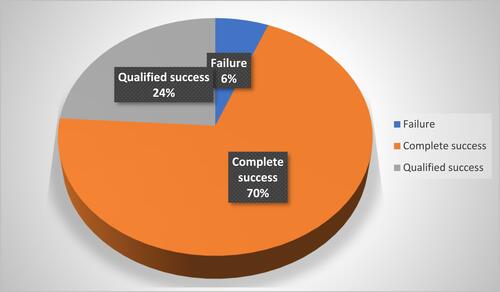
Table 6 Distribution of the Studied Patients According to Development of Complications
Figure 3 Pie chart showing distribution of the studied patients according to postoperative complications.
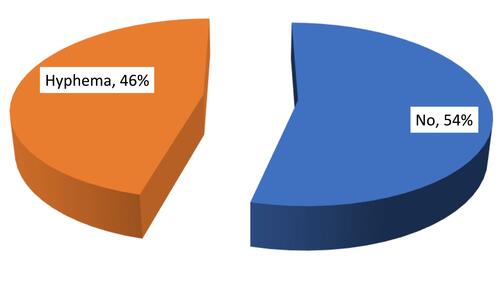
Table 7 Distribution of Patients According to Next Surgical Intervention
Table 8 Relation Between Surgical Outcome and the Studied Parameters
Table 9 Relation Between Type of Success and the Studied Parameters