Figures & data
Table 1 Demographic and Clinical Profile of Patients with Adult Primary Glaucoma
Table 2 List of Proteins Related to Apoptosis, Autophagy and TGF Beta Signaling Pathways in the Trabecular Meshwork of Patients with Severe Adult Primary Glaucoma
Figure 1 (A) shows the box plot of the protein expressions in triplicate samples of each of primary open angle glaucoma, primary angle closure glaucoma and controls showing very little variability among the triplicate experiments. (B) shows the venn diagram of differential expression of proteins among glaucoma and controls while (C) shows the heat map of the significantly differentially expressed proteins primarily belonging to two clusters as shown.
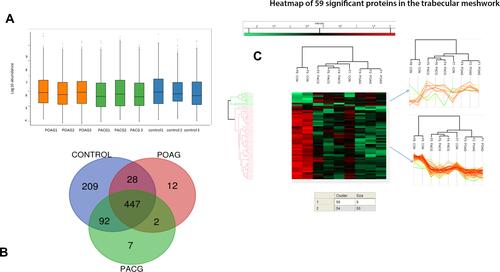
Figure 2 (A) MTT assay of Human trabecular meshwork cells after oxidative stress with H2O2. (B) shows the representation of FACS analysis of cells at 72 hours compared with control (Q1: necrotic cells, Q2: early apoptotic cells Q3: healthy cell, Q4: late apoptotic cells). (C) showing percentage of early and late apoptotic cells maximum at 72 hours in 600 uM of H2O2 concentration. Means ± SEM shown, *p<0.05, **p<0.01, ***p<0.001, ****p<0.0001 one way ANOVA post hoc t test with Tukey correction.
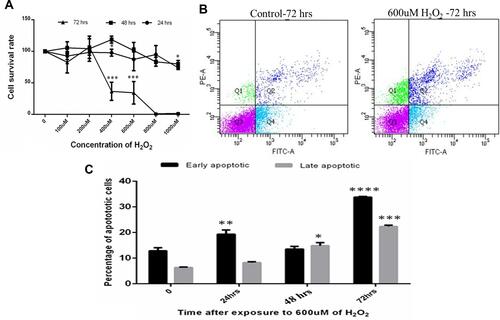
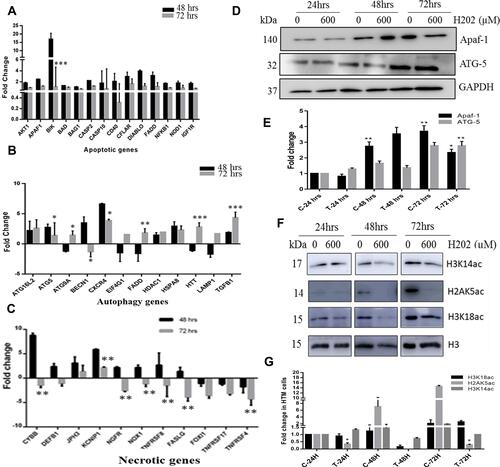
Figure 3 Relative gene expression of apoptosis (A), autophagy (B), and necrosis (C) related genes in in-vitro primary human trabecular meshwork cells after 48 hours and 72 hours of oxidative stress with H2O2 relatively compared with control and normalized with the average CT of ACTB, GAPDH, HPRT1, RPLP20 and HGDC. (D and E) protein expression of apoptosis and autophagy markers and densitometry analysis in HTM cells after 600uM H202 treatment in HTM cells at 24, 48 and 72 hours by western. (F and G) epigenetic modifications of histones ie, H2 and H3 and densitometry analysis after 600 uM of H2O2 treatment in HTM cells at 24, 48 and 72 hours. Means ± SEM shown, *p<0.05, **p<0.01, ***p<0.001 one way ANOVA post hoc t test with Tukey correction.