Figures & data
Table 1 General Characteristic of Study Participants
Figure 1 Diagrams of custom-built VR-O&M course used in this study. (A) Different views of the colorized and bright practice test run delivered to each subject prior to dark-adaptation and formal testing shows the relative size of the subject with respect to the obstacles. (B and C) Subject’s position relative to the course run as seen from the system’s computer station. Shown are scenes from the “arrows only” simulation (A) and the “arrows plus obstacles” simulation (B). The trackers on the feet appear as pale grey ovals and, on the hands, as pale grey controllers. There is no door at the end of the “arrows only” course, but there is a door at the end of the “arrows plus obstacles” course. A caricature of a head (in white) wearing the headset is used to know the general direction of the subject’s gaze and position in the virtual space relative to the path and objects. (D and E) Additional perspectives of the VR&O&M course. The starting platform is an orange circle with a polyhedral pattern at the beginning of the path of arrows both simulations. The tester receives a feedback alert (green arrows) when the software automatically detects collisions, small red circles point to the “site of contact” between the subject’s body controllers with the obstacles. A view from above in (E) shows the subject negotiating the threshold of the “exit door” that signals the end of the run.
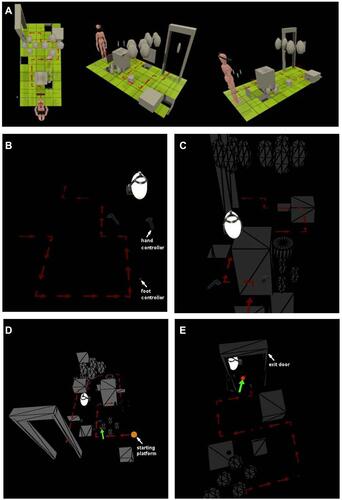
Figure 2 Structural–functional relationships in patients included in the study.Notes: (A) Color fundus images of the right eye of two of the patients. (B) Goldmann kinetic perimetry with large targets (V-4e and IV-4e) in untreated patients demonstrating limited extent of the visual fields (to the central 20–40°) and no perception of smaller targets. (C) 7 mm-long, non-straightened, SD-OCT cross-sections along the vertical (VR21) and horizontal (VR25) meridian through the fovea in two patients. Nuclear layers are labeled (ONL, outer nuclear layer, INL, inner nuclear layer, GCL, ganglion cell layer). Visible outer photoreceptor/RPE sublaminae are labeled (ELM, external limiting membrane; EZ, inner segment/outer segment ellipsoid region) following conventional terminology. T, temporal; N, nasal; I, inferior, S, superior retina. Calibration bar to the bottom left. The images illustrate severe foveal abnormalities and the asymmetric extent of the degree photoreceptor preservation around the foveal center (T > N, S > I) at this stage in patients from this family with RPE65-LCA. Asterisk denotes points to severe foveal ONL thinning with approximation of the EZ band to the RPE (VR21) or interruption (VR25). Bar above the scan show psychophysically determined cone (light-adapted, white stimulus). Dotted line above bar defines lower limit (mean – 2SD) of sensitivity for control subjects. Images illustrate structural functional dissociation with severe retinal dysfunction contrasting with relatively preserved central retinal structure. Adapted with permission from Maguire AM, Bennett, J, Aleman E, et al. Clinical Perspective: Treating RPE65-Associated Retinal Dystrophy. Mol Ther. 2021;29(2):442-463.Citation5
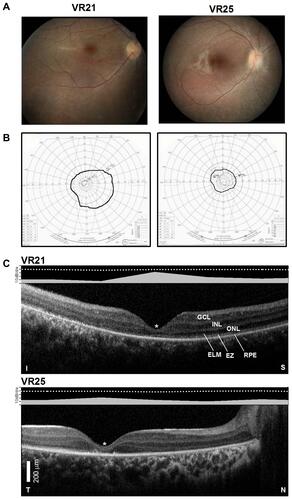
Figure 3 Performance parameters of the virtual reality orientation and mobility test. Shown are data points for timing and collision parameters for each run as a function of the luminance of the path of arrows (A) or of the arrows + obstacles (B) in control subjects (gray symbols) compared to patients (black symbols). Thick black line in (B) fits a preliminary exponential decay function [y=21.2*exp(−33.5*x); r=0.68] describing the relationship between the number of collisions and the luminance of the objects in the VR-O&M course in control subjects.
![Figure 3 Performance parameters of the virtual reality orientation and mobility test. Shown are data points for timing and collision parameters for each run as a function of the luminance of the path of arrows (A) or of the arrows + obstacles (B) in control subjects (gray symbols) compared to patients (black symbols). Thick black line in (B) fits a preliminary exponential decay function [y=21.2*exp(−33.5*x); r=0.68] describing the relationship between the number of collisions and the luminance of the objects in the VR-O&M course in control subjects.](/cms/asset/d2cc8b7c-bf2a-4182-9681-3de2c52ffeca/doph_a_12177174_f0003_b.jpg)
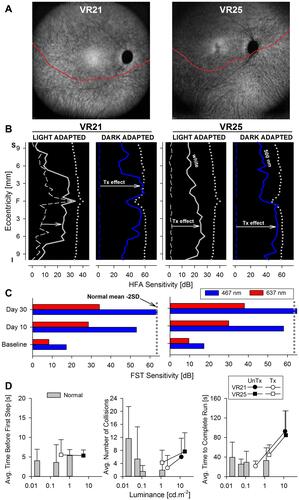
Figure 4 Changes in retinal sensitivity and performance of RPE65-LCA patients on the virtual reality orientation and mobility test after gene therapy.Notes: (A) NIR-FAF, 55°-wide images of the posterior retina of the right eye of the two with RPE65-LCA treated with bilateral subretinal gene therapy (Luxturna, Sparks Therapeutics Inc., Philadelphia, PA, USA). Red line denotes the inferior boundary of a subretinal bleb that contains the treating agent, which extended from the superior retina crossing the fovea and into the inferior pericentral retina. (B and C) Changes in retinal sensitivity measured by automated static perimetry (B) and FST (C) after gene therapy. (B) Light-adapted achromatic and dark-adapted two-color chromatic static perimetry (shown only responses to a blue 500 nm stimulus) in the patients before (dashed lines) and after (continuous line) gene therapy. Dotted lines define lower limit (mean – 2SD) of sensitivity in control subjects. S, superior; I, inferior visual field. Horizontal arrows show the improvement in sensitivity supporting a treatment effect. (C) FST sensitivity estimates measured with spectral stimuli (blue, 467 nm; red, 637 nm) in dark-adapted (>30 min) patients. Dotted gray line is the lower limit (mean-2SD) of the sensitivity to the short wavelength 467 nm stimulus in control subjects. Values are converted into positive dB values from possible negative outputs from the FST instrument. (D) Summary VR-O&M parameters in patients compared to control subjects in this study for timing orientation parameter in the “arrows only” test (left panel), and for collisions (middle panel) and performance timing (right panel) of the “arrows plus obstacles” test. Shown are mean values + 2SD. Data points for patients before treatment (pre-Tx = black symbols) are connected to post-treatment (post-Tx; white symbols) values to demonstrate the main shift in performance. VR21 did not undergo “arrows only” testing post-treatment. Panels A-C reproduced with permission from Maguire AM, Bennett, J, Aleman E, et al. Clinical Perspective: Treating RPE65-Associated Retinal Dystrophy.Mol Ther. 2021;29(2):442–463.Citation5