Figures & data
Table 1 Characteristics of the Patients
Table 2 Change of Intraocular Pressure (IOP), Visual Acuity (VA) and Number of Medications After 12 Months and 24 Months of Observation
Table 3 Change of Intraocular Pressure (IOP) After 12 Months and 24 Months of Observation
Table 4 The Amount of Intraocular Pressure (IOP) Lowering Medications Surgery and 24 Months Post-Op
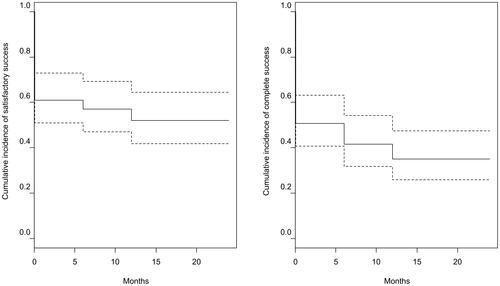
Figure 1 Kaplan–Meier cumulative incidence of effective treatment and complete success. Dotted lines indicate 95% confidence interval. Complete success was defined as an intraocular pressure (IOP) <15 mmHg without drugs, the effective treatment success was defined as IOP < 15 mmHg with or without drugs.