Figures & data
Figure 1 HD-OCT showing the hyperreflective epithelium boundaries, corresponding to tear film and anterior surface of Bowman layer, respectively.
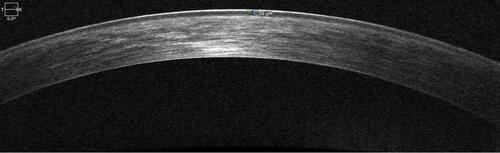
Table 1 Regional Mean Epithelial and Corneal Thickness Associations
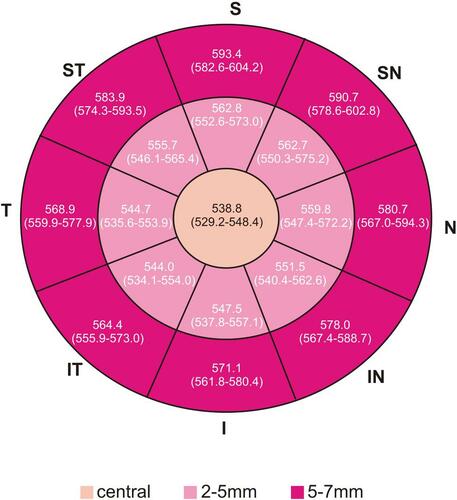
Figure 2 Representative corneal epithelial thickness map. Numbers represent mean (95% CI for mean).
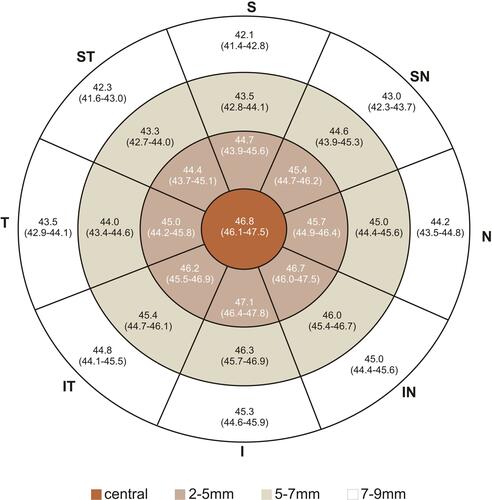
Table 2 Epithelial and Corneal Thickness Differences Between Opposite Octants
Table 3 Epithelial and Corneal Thickness Variations Between Gender
Figure 3 Representative corneal epithelial thickness in boys. Numbers represent mean (95% CI for mean).
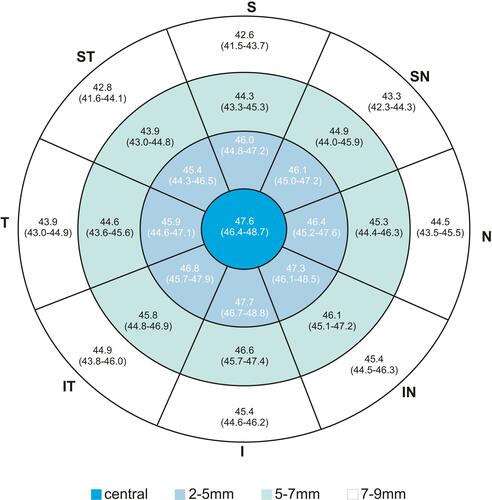
Figure 4 Representative corneal epithelial thickness in girls. Numbers represent mean (95% CI for mean).
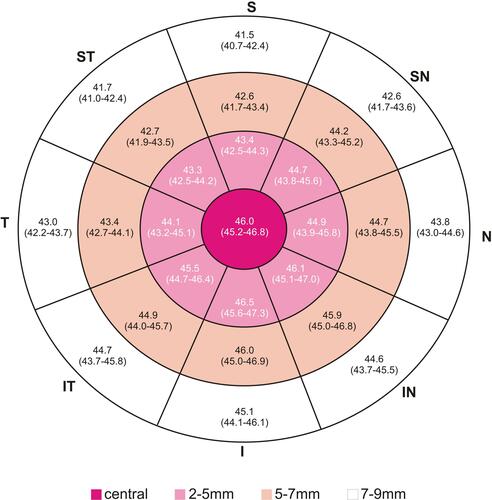
Figure 5 Representative corneal thickness map. Numbers represente mean (95% CI for mean).
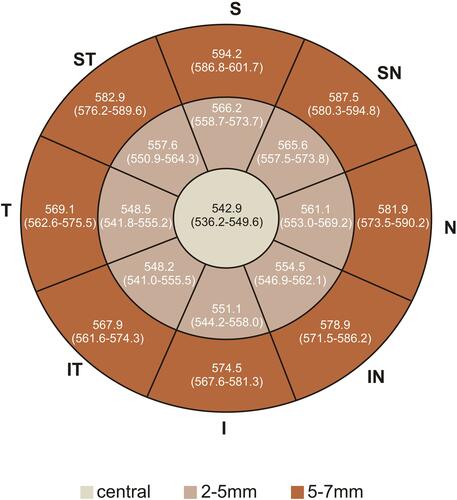
Figure 6 Representative corneal epithelial thickness map in boys. Numbers represent mean (95% CI for mean).
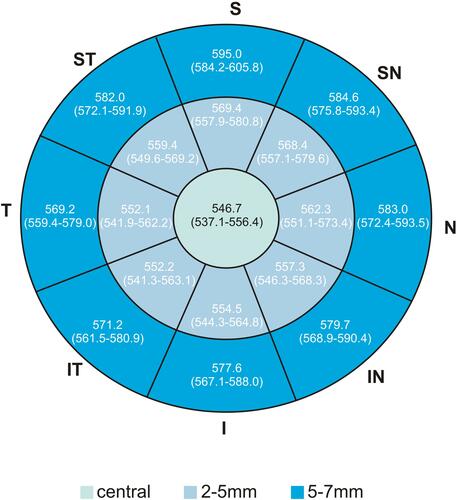
Figure 7 Representative corneal epithelial thickness map in girls. Numbers represent mean (95% CI for mean).