Figures & data
Table 1 Baseline characteristics of the study population
Figure 1 Patterns of BVMD lesion on SS-OCT scans. Pattern I consists of a homogeneous subretinal hyperreflective dome-shaped lesion with overlying retinal thinning and no neurosensory retinal detachment. Pattern II consists of a solitary subretinal hyperreflective elevated lesion surrounded by localized neurosensory retinal detachment. Pattern III consists of subretinal hyperreflective amorphous material scattered within localized neurosensory retinal detachment.
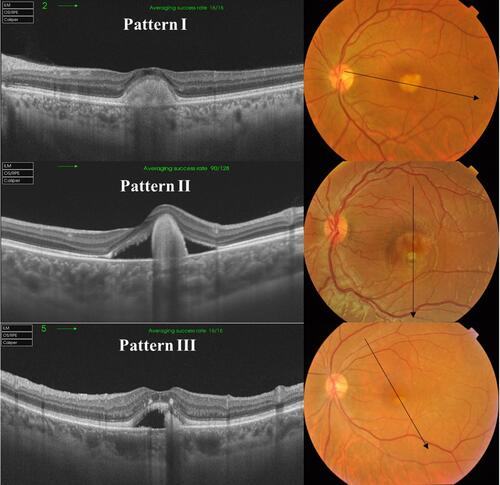
Table 2 Correlation between patterns of BVMD lesion and coregistered SS-OCT B-scan flow signals versus pseudoflow
Table 3 Correlation between LT/RT% and pseudoflow
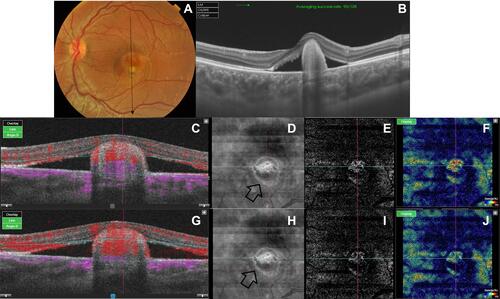
Figure 2 (A) Color fundus photo of the left eye of a 16-year-old male patient with BVMD. The paramacular lesion is composed of a single rounded yellowish-white subretinal nodule with sharply circumscribed boundaries. The nodule is surrounded by an area of neurosensory retinal detachment approximately three disc diameters (DD) in size. The macular area shows diffuse RPE mottling. (B) Corresponding structural SS-OCT in 9 mm-line scan mode shows a pattern II lesion. (C) Coregistered SS-OCT B-scan with flow overlay of the same eye before application of custom segmentation. Note the dense flow signal (red), significant elevation of the lesion, and relatively broad apical surface area. The default slab defining the IPL–INL is distorted by the vitelliform lesion. (D) En face structural SS-OCT image of the outer retina before application of custom segmentation. The image shows a hyperreflective lesion surrounded by a hyporeflective rim, possibly due to signal attenuation by neurosensory retinal detachment (black arrow). (E, F) En face SS-OCTA image of the outer retina of a 6×6 mm area and corresponding flow-density map. Note the hyperintense decorrelation signal suggestive of flow within a neovascular complex. (G) Coregistered SS-OCT B-scan with flow overlay of the same patient after adjustment of the contour of the segmentation slab to follow the IPL–INL junction. (H) En face structural SS-OCT image of the outer retina after application of custom segmentation. Note that the intensity of signal produced by the lesion is not affected by adjustment of the segmentation slab (black arrow). (I, J) En face SS-OCTA image of the outer retina and corresponding flow-density map after customized segmentation. Images show an avascular outer retina, which indicated that the previously noted hyperintense decorrelation signal was pseudoflow due to projection artifact.
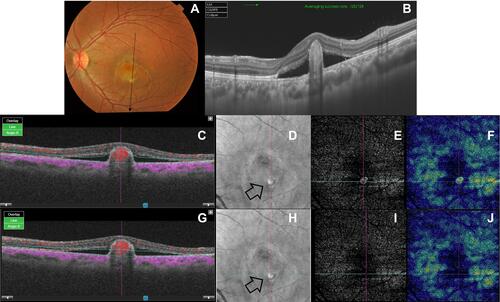
Figure 3 (A) Color fundus photo of the left eye of an 18-year-old male with BVMD. The macular area shows a yellowish-white solitary elevated subretinal lesion >0.5 DD in size. The lesion has well-defined boundaries and is surrounded by localized neurosensory retinal detachment. (B) Corresponding structural SS-OCT in 9 mm line-scan mode shows a pattern II lesion. (C) Coregistered SS-OCT B-scan with flow overlay of the same eye shows dense flow signal (red) within the apical portion of the lesion. Note that the lesion caused distortion of the default segmentation slab defining the IPL–INL junction. (D) En face structural SS-OCT image of the outer retina before application of custom segmentation. The image shows a hyperreflective lesion surrounded by a hyporeflective rim, possibly due to signal attenuation by neurosensory retinal detachment (black arrow). (E, F) En face SS-OCTA image of the outer retina and corresponding color-coded flow-density map of a 6×6 mm area show a hyperintense signal suggestive of flow within a neovascular network. (G) Coregistered SS-OCT B-scan with flow overlay after realignment of the contour of the IPL–INL slab. (H) En face structural SS-OCT image of the outer retina after application of custom segmentation. Note that the intensity of signal produced by the lesion is not affected by adjustment of the segmentation slab (black arrow). (I, J) En face SS-OCTA image of the outer retina and corresponding flow-density map after customized segmentation. Images show an avascular outer retina, indicating that the previously noted hyperintense decorrelation signal was pseudoflow due to projection artifact.
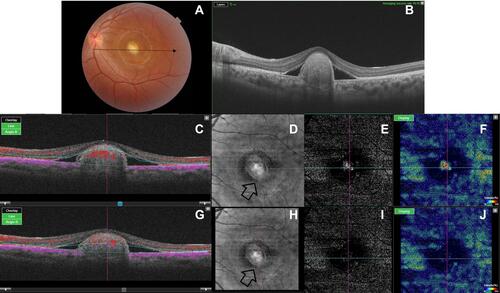
Figure 4 (A) Color fundus photo of the right eye of a 16-year-old male with BVMD. The macular area shows a solitary yellowish-white subretinal nodule with overlying RPE clumps. The lesion is approximately 0.3 DD in size and is surrounded by localized neurosensory retinal detachment. (B) Corresponding structural SS-OCT in 9 mm line-scan mode shows a pattern II lesion. (C) Coregistered SS-OCT B-scan image with flow overlay shows a flow signal at the apex of the lesion (purple). Note displacement of the default slab defining the IPL–INL by the lesion. (D) En face structural SS-OCT image of the outer retina before application of custom segmentation. The image shows a hyperreflective lesion surrounded by a hyporeflective rim, possibly due to signal attenuation by neurosensory retinal detachment (black arrow). The hyporeflective dot within the lesion corresponds to RPE clumps seen in the color photo. (E, F) En face SS-OCTA image of the outer retina and corresponding flow-density map show hyperintense decorrelation signal suggestive of a bilobe active neovascular complex. (G) Coregistered SS-OCT B-scan image with flow overlay after re-alignment of the displaced IPL–INL slab. (H) En face structural SS-OCT image of the outer retina after application of custom segmentation. Note that the intensity of the signal produced by the lesion is not affected by adjustment of the segmentation slab (black arrow). (I, J) En face SS-OCTA image of a 6×6 mm area of the outer retina and corresponding flow-density map after customized segmentation. The previously noted hyperintense decorrelation signal is not detectable, which indicated pseudoflow due to projection artifact.
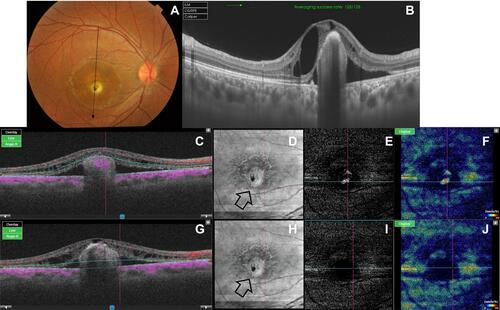
Figure 5 (A) Color fundus photo of the left eye of a 9-year-old male with BVMD. The macular area shows a solitary yellowish-white sub-retinal nodule <0.3 DD. The nodule is surrounded by localized neurosensory retinal detachment. (B) Corresponding structural SS-OCT in 9 mm line-scan mode shows a pattern II lesion. (C) Coregistered SS-OCT B-scan image with flow overlay shows a dense flow signal within the apex of the lesion (red). Note distorted default slabs defining IPL–INL and BM layers. (D) En face structural SS-OCT image of the outer retina before application of custom segmentation. The image shows a hyperreflective lesion surrounded by a hyporeflective rim, possibly due to signal attenuation by neurosensory retinal detachment (black arrow). (E, F) En face SS-OCTA image of a 3×3 mm area of the outer retina and corresponding flow-density map show a hyperintense decorrelation signal, denoting flow within a neovascular network. (G) Coregistered SS-OCT B-scan image with flow overlay after custom segmentation. (H) En face structural SS-OCT image of the outer retina after application of custom segmentation. Note that the intensity of the signal produced by the lesion is not affected by adjustment of the segmentation slab (black arrow). (I, J) Note substantial attenuation of the previously noted hyperintense decorrelation signal after elimination of pseudoflow. Note absent arborization, looping, and anastomosis, which indicates minimal activity or a vascularized scar.