Figures & data
Figure 1 Chart of predictability, demonstrating the achieved spherical equivalent refraction as a function of attempted spherical equivalent refraction.
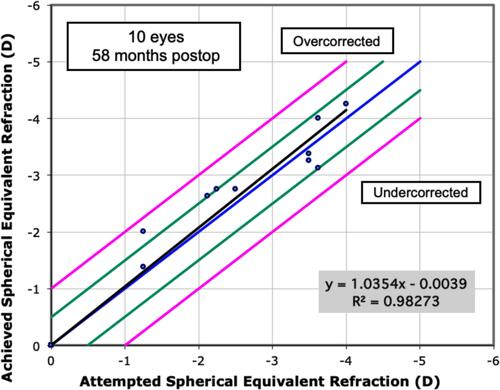
Figure 2 Graph of spherical equivalent (SE) accuracy. At last follow-up, nine out of ten eyes had SE within ± 0.50 D and all eyes were within ± 1.00 D.
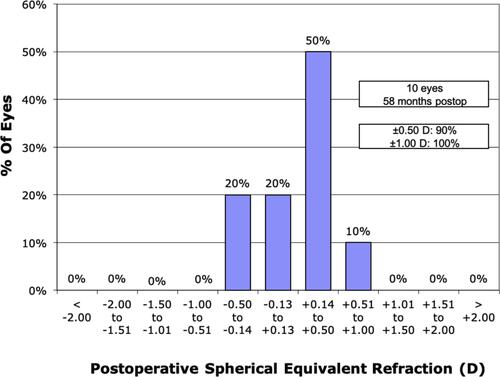
Figure 3 Graph of change in corrected distance visual acuity, demonstrating the gain of lines in 1 eye and stability in the rest of the eyes.
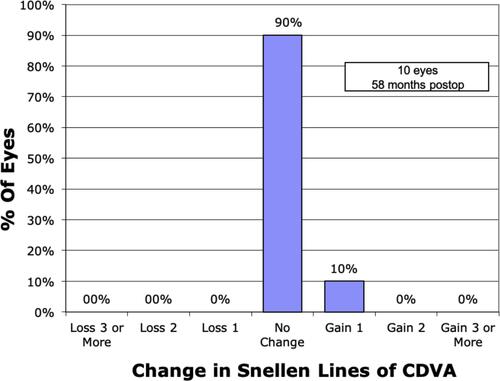
Figure 4 Graph demonstrating the stability of spherical equivalent refraction after the 6th month follow up in all eyes (x axis denotes the follow up period in months and the number of eyes in parenthesis).
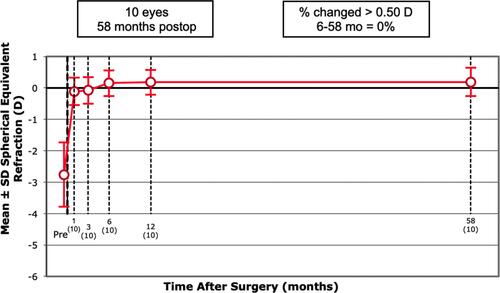
Figure 5 Corneal topography of two patients (one eye from each patient) who had undergone combined photorefractive keratectomy and corneal crosslinking for the correction of their refractive error. Axial maps preoperatively (A and B), 6 months postoperatively (C and D), 5 years postoperatively (E and F) and comparative maps showing postoperative stability up to last follow-up (G and H).
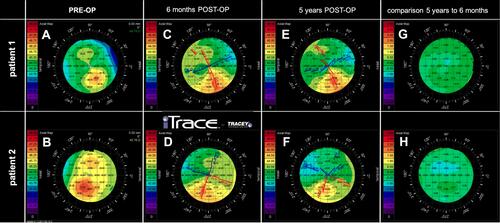
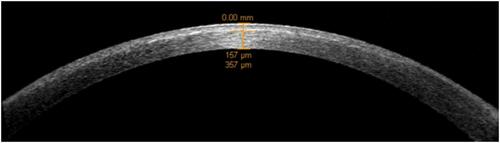
Figure 6 Anterior segment optical coherence tomography (AS-OCT) of a patient that underwent combined photorefractive keratectomy and corneal crosslinking for the correction of his refractive error showing the depth of the demarcation line.