Figures & data
Table 1 Demographics and Baseline Characteristics for AREDS2 in the Non-Comparative Study Arm
Table 2 Demographics and Baseline Characteristics for Comparative Analysis of AREDS2 and Untreated Eyes
Figure 1 Study schematic demonstrating study design and cohort composition.
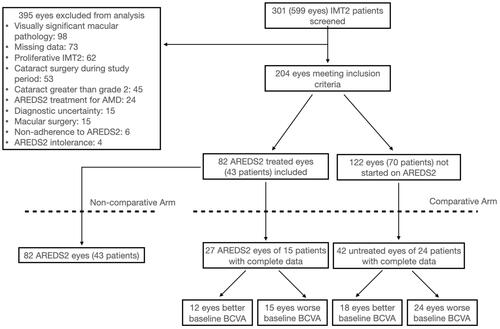
Table 3 Non-Comparative Study Arm Visual and OCT Outcomes for AREDS2 Eyes After 24 Months of Supplementation
Table 4 AREDS2 vs Untreated Eyes BCVA and Optical Coherence Tomography Outcomes
Table 5 OCT and Visual Outcomes After Better/Worse Baseline Visual Acuity Analysis for AREDS vs Untreated Eyes
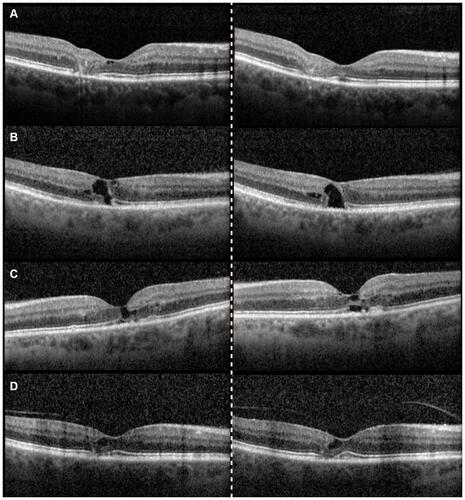
Figure 2 Representative examples of ellipsoid zone (EZ) loss on spectral domain optical coherence tomography (SD-OCT) for untreated (A–B) and Age-Related Eye Disease Study 2 (AREDS2) treated eyes (C–D). SD-OCT images on the right show baseline imaging while the left is from 2-year follow-up. (A) showing an untreated eye at baseline with 20/30−1 visual acuity and an EZ defect of 488 mm. Subsequent 2 years follow-up reveals a worsening EZ defect of 617 mm and stable VA of 20/30−1. (B) depicts an untreated eye with 20/30−2 vision and 262 mm of EZ loss. At 2 years, vision acuity declines to 20/40+2 and EZ loss progressed to 568 mm. (C) is of a AREDS2 treated eye with baseline visual acuity of 20/25+2 and EZ defect of 467, both of which remain relatively similar at 2 years (20/20 and 474 mm). (D) showing an AREDS2 treated eye with 20/30−1 baseline visual acuity and 272 mm EZ loss length. Visual acuity and EZ loss length remain stable at 2 years at 20/30 and 285 mm, respectively.