
Figures & data
Table 1 Demographics and Monocular Diagnostic (Postoperative) Refractive and VA Data
Figure 1 Binocular uncorrected visual acuity by distance and IOL type.
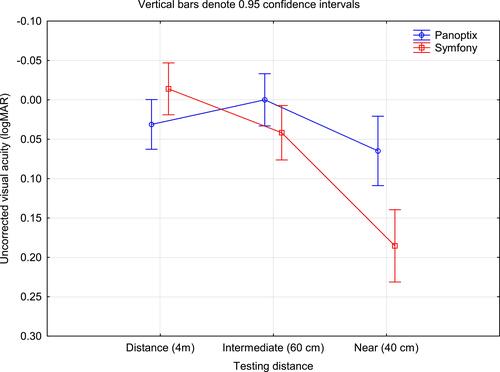
Figure 2 Binocular distance-corrected visual acuity by distance and IOL type.
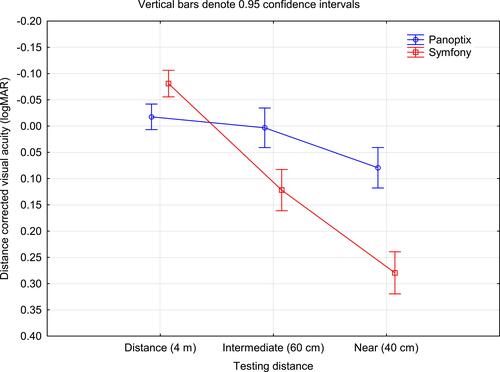
Figure 3 Photopic contrast sensitivity by IOL type.
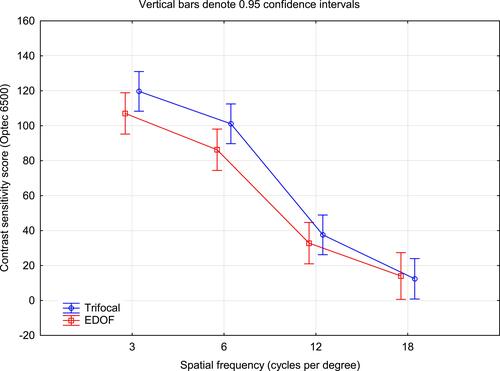
Figure 4 Mesopic contrast sensitivity by IOL type.
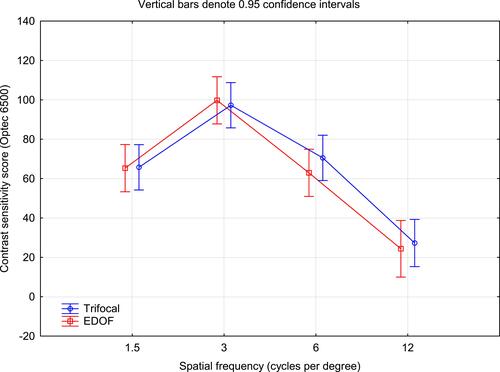
Table 2 Reported Need for Spectacles by Distance and IOL Group
Table 3 Satisfaction with Vision by Distance and IOL Group
Table 4 Reported Frequency of Spectacle Wear by Distance and IOL Group
Table 5 Reported Ability to Function without Spectacles by Distance and IOL Group
Figure 5 Summary scores for the Quality of Vision questionnaire.
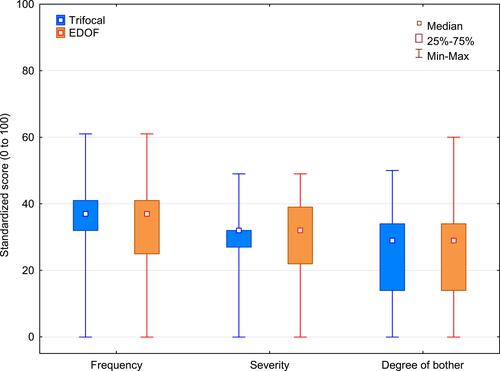
Table 6 Frequency, Severity and Degree of Bother for Select Visual Disturbances by IOL Group