
Figures & data
Table 1 Healthcare Provider (HCP) Survey (n=501)
Table 2 Demographic and Clinical Characteristics in the Pre-Index Period Among Patients with DED Treated with Lifitegrast (n=600)
Table 3 Lifitegrast Utilization Among Patients with DED
Figure 1 Proportion of patients with DED-related treatments in the 6-month pre-index period and added to lifitegrast in the post-index period (n=600)*. Vertical bars indicate 95% confidence intervals. Patients may have multiple DED-related treatments; therefore, the sum of percentages may exceed 100%. *11 patients (1.8%) switched from lifitegrast to other therapies during the post-index period. These patients are not included in .
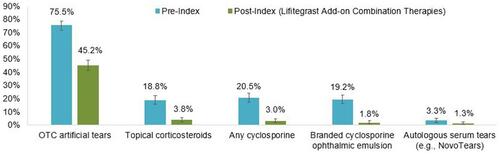
Table 4 Patients with DED Symptoms Reported in the Pre- and Post-Index Periods
Table 5 DED Questionnaires in the Pre- and Post-Index Periods
Table 6 DED Sign Assessments in the Pre- and Post-Index Periods