
Figures & data
Figure 1 (A) Contoura HOA ablation map in a representative keratoconus eye. (B) Graphical representation of the distance from center and position features of an ablation island. The distance from center (ρ) is defined as the radius (in mm) between the origin of the HOA ablation map (X = 0 and Y = 0 coordinates) and the centroid of any ablation island. The centroid denoted by the white asterisk (*) is calculated as the arithmetic mean of the X and Y coordinates of all pixels forming the ablation island (in this example, all purple pixels). The orientation (θ) of the ablation island is defined as the angle (between 0 to 360º) formed between the centroid of the ablation island and the abscissa (dotted line). (C) Graphical representation of the orientation and diameter features of an ablation island. The orientation (α) of an ablation island is defined as the angle (reported between 0 to 180º) formed between the longest diagonal of the ablation island (termed major axis in geometry) and the dotted horizontal line passing by the centroid of the ablation island. The diameter of an ablation island was defined as the length of the major axis (d). In addition to the above-defined parameters, we calculated the area (mm2) and sphericity of each ablation island. The area was calculated by multiplying the number of pixels by the area of one pixel. The sphericity of an ablation island was defined as 4π times area divided by the square of the perimeter. Sphericity is equal to 1.0 for a perfect circle and it is smaller than 1.0 for an ellipse or a crescent shape.
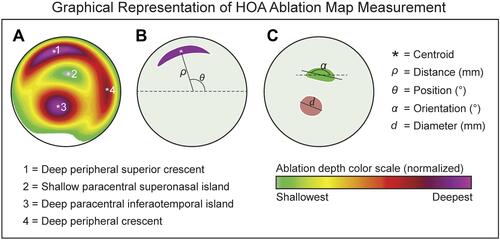
Table 1 Description of Pentacam/Corvis Indices and Keratoconus Grade
Figure 2 Individual HOA ablation maps, epithelium thickness profiles and Pentacam imaging data (4 Maps – Refractive view).
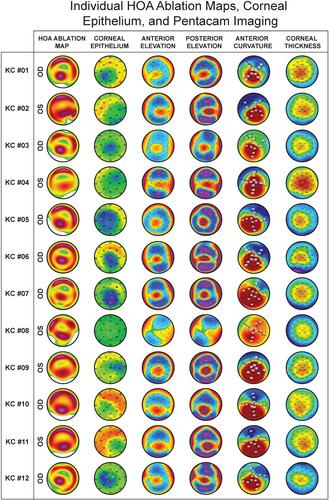
Figure 3 Individual HOA ablation maps. On each map, yellow/green colors indicate shallower ablation values and red/purple colors deeper ablation values. Each map is normalized to its deepest ablation value, so that all maps comprise the same range of colors. There were one or two red/purple peripheral ablation crescents (identified as Island #1 and #4), a yellow/green paracentral superonasal ablation island (Island #2), and a red/purple paracentral inferotemporal ablation island (Island #3) in each HOA map. Each of the HOA ablation map islands were quantitatively characterized in terms of distance from center, position, orientation, sphericity, diameter, area, and depth.
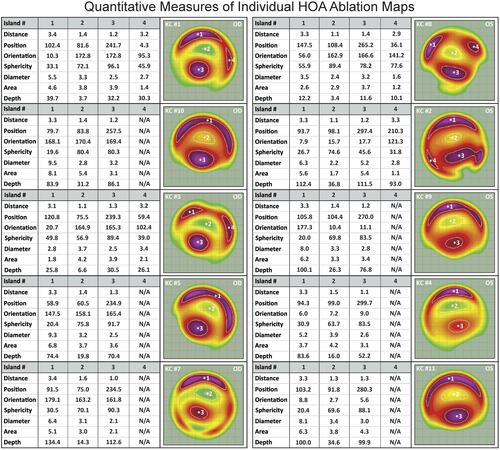
Table 2 Mean and Range of Descriptors of the Four HOA Ablation Profile Islands Identified in KC Eyes
Figure 4 (A) Group data of the four ablation islands. The yellow/green superonasal ablation islands (island #2; green circles) and the red/purple inferotemporal ablation islands (Island #3; red diamonds) were highly reproducible in terms of distance from center and angular position, while their ablation depth varied more. The distance from center of the deep peripheral ablation islands (Island #1 and Island #4; purple markers) was highly reproducible, with a larger range of depth. (B) Composite HOA ablation map obtained by averaging the HOA ablation map of all 12 KC cases.
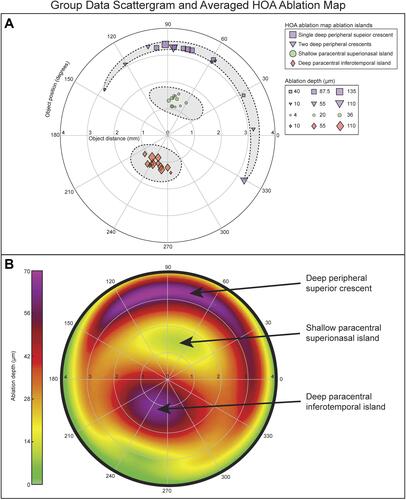
Table 3 Pearson Correlation Between Ablation Depth and Pentacam Indices