Figures & data
Table 1 Summary of the Preoperative and Postoperative Monocular Visual and Refractive Data of the Analyzed Sample
Figure 1 Distribution of 3-month postoperative monocular visual acuity data in the analysed sample.
Abbreviations: UDVA, uncorrected distance visual acuity; CDVA, corrected distance visual acuity; UNVA, uncorrected near visual acuity; DCNVA, distance-corrected near visual acuity.
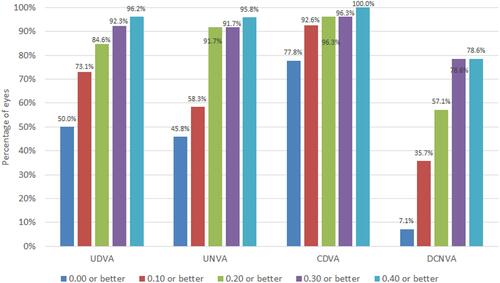
Figure 2 Distribution of 3-month postoperative refractive data in the analysed sample.
Abbreviation: SE, spherical equivalent.
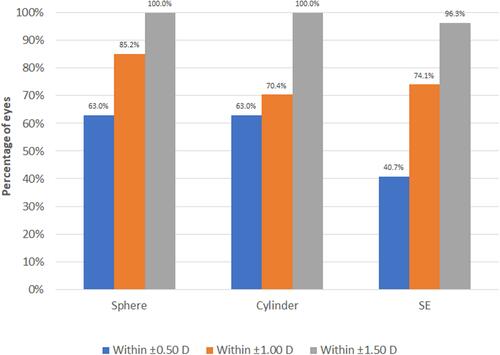
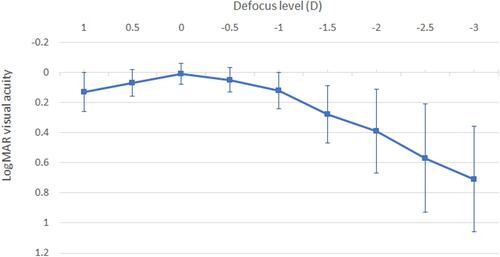
Figure 3 Mean monocular defocus curve obtained at 3 months after surgery in the analysed sample.