Figures & data
Table 1 Demographics
Table 2 Refractive Results
Table 3 Arithmetic RPE, Absolute RPE and Median Absolute Error
Figure 1 Boxplot of (A) arithmetic and (B) absolute prediction error.
Notes: *Adjusted p ≤0.05; ***adjusted p <0.001 (mixed models estimates different from Anterion OKULIX).
Abbreviation: RPE, refractive prediction error.
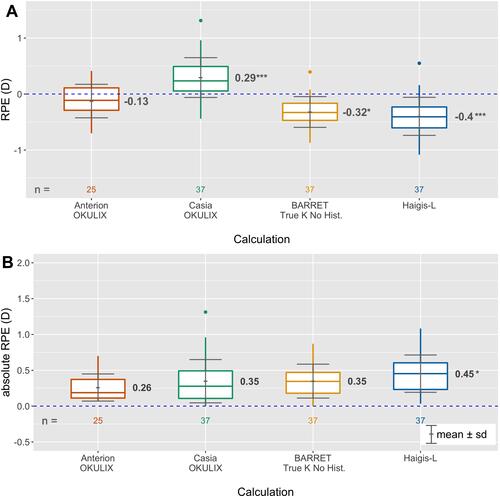
Figure 2 Percentages of eyes within certain range of RPE.
Notes: *Logistic mixed models estimates statistically significantly different from Anterion-OKULIX (Holm-Bonferroni adjusted p-values).
Abbreviations: Abs, absolute; RPE, refractive prediction error; p, adjusted p-value.
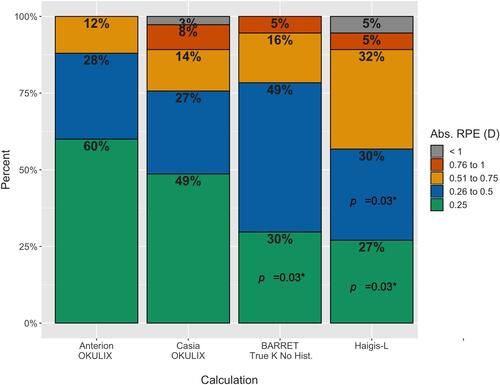
Figure 3 Bland–Altman plot with 95% limits of agreement between two repeated measurements/calculations of RPE with (A) Anterion-OKULIX, and (B) Casia-OKULIX.
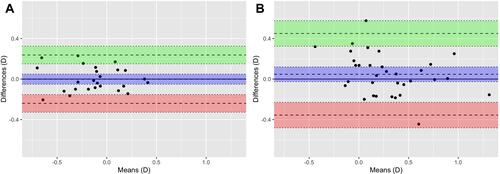
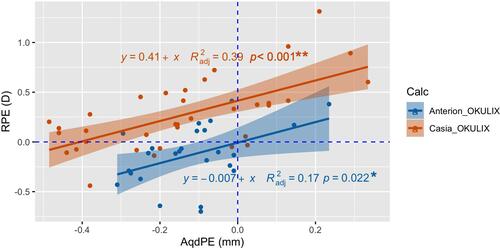
Figure 4 Correlation between RPE and aqueous depth prediction error for the OCT devices.
Notes: *Slope statistically significant; **intercept and slope statistically significant.
Abbreviations: RPE, refractive prediction error (D); AqdPE, aqueous depth prediction error (mm); Calc, IOL-calculation.