Figures & data
Table 1 Baseline Demographical & Clinical Characteristics
Table 2 Univariable Cox Regression Results
Figure 1 Kaplan-Meier plot shows the differences in cumulative cause-specific survival over time for choroidal cancer patients between 25 and 49 years of age. (top, red line) as compared to patients aged 75+ (bottom, orange line). The log-rank (Mantel-Cox) test showed that the cause-specific survival distributions for the different levels of aged groups at diagnosis are significantly different (p < 0.001).
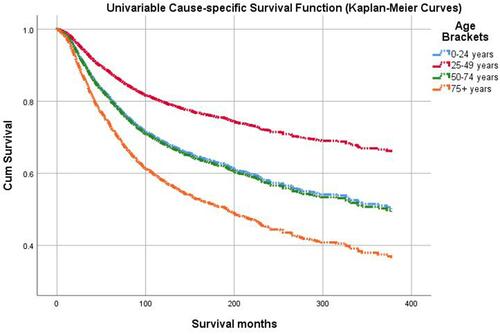
Figure 2 Kaplan-Meier plot shows the differences in cumulative other-cause survival over time for choroidal cancer patients aged 25–49 (red line) as compared to aged 75+ patients (bottom, orange line). The log-rank (Mantel-Cox) test showed that the other-cause survival distributions for the different levels of aged groups at diagnosis are significantly different (p < 0.001).
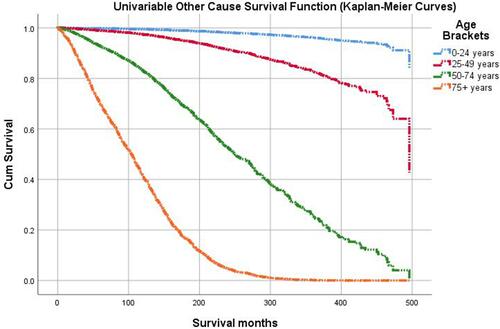
Table 3 Multivariable Cox Regression Results
Figure 3 Kaplan-Meier plot shows the differences in cumulative cause-specific survival over time for the choroidal cancer patients aged 25–49 years (top, red line) as compared to patients aged 75+ years (bottom, orange line), using Cox-model based estimates after adjusting for confounding variables.
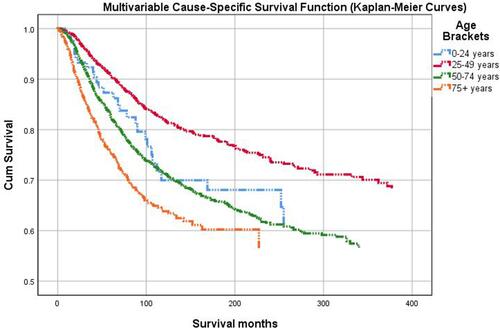
Figure 4 Kaplan-Meier plot shows the differences in cumulative other-cause survival over time for choroidal cancer patients aged 0–24 years (top, blue line) as compared to patients aged 75+ years (bottom, orange line), using Cox-model based estimates after adjusting for confounding variables.
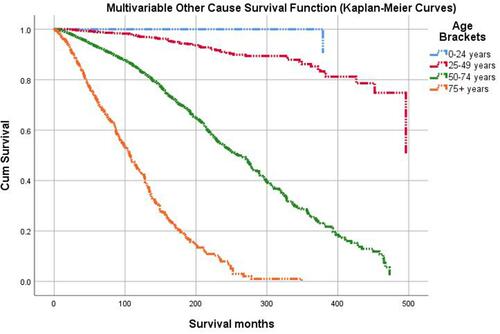
Table 4 Multi-Variable Cox Regression Results (Continued)
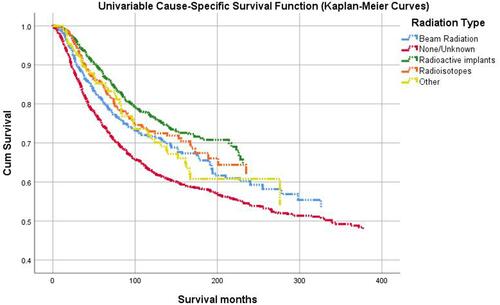
Figure 5 Kaplan-Meier plot shows the differences in cumulative univariable cause-specific survival over time for choroidal cancer patients treated with radioactive implants (top, green line) as compared to patients treated with no or unknown treatments (bottom, red line) using Cox-model based estimates. The log-rank (Mantel-Cox) test showed that the cause-specific survival distributions for the different radiation treatment groups are significantly different (p < 0.001).