Figures & data
Figure 1 Photographs (A, C, E and G) and diagram (B, D, F and H) showing pars planectomy technique. (A, B) A fornix-based conjunctival incision was created at 2 mm from the limbus with a length of 5–6 mm. (C, D) A half-thickness scleral flap with a size of 2×1.5 mm2 was created at 4.5 mm from the limbus. (E, F) A pars plana window with a size of 0.5×0.5 mm2 was created precisely at 3 mm from the limbus, and exposed uveal tissue was cauterized to create a uveal window. (G, H) The scleral and conjunctival flap were closed with Nylon 10–0 monofilament sutures. (B, D, F and H) were illustrated by the authors. Permissions were already obtained.
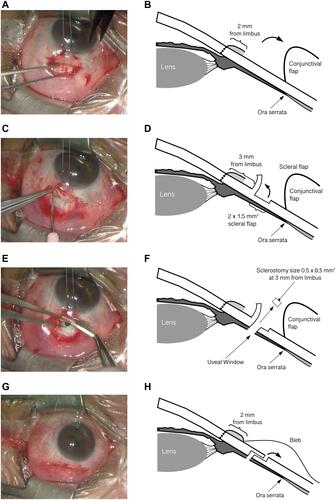
Table 1 Baseline Characteristics of the Study Patients
Figure 2 Changes of mean intraocular pressure after pars planectomy in vitrectomized eyes with glaucoma.
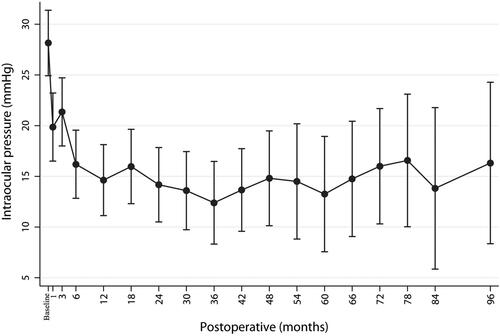
Figure 3 Changes of mean number of medications after pars planectomy in vitrectomized eyes with glaucoma.
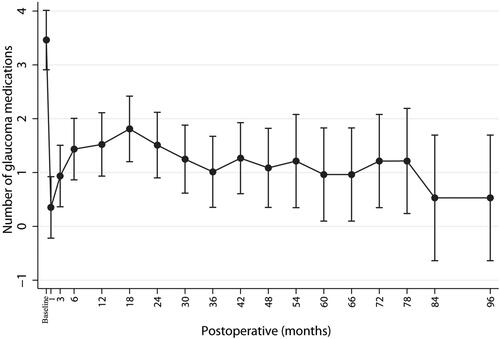
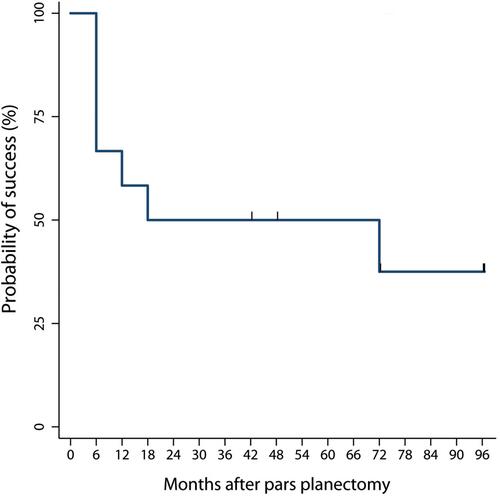
Figure 4 Kaplan–Meier survival curve of surgical outcomes for 12 patients who underwent pars planectomy. Vertical lines denote censored data (loss to follow-up).