Figures & data
Table 1 Patients’ Demographics and Clinical Characteristics
Table 2 Main Disease Parameters Before and After Surgery and Degree of Improvement
Figure 1 Scatter plot comparing preoperative IOP with IOP at final follow-up visit.
Notes: Dots below the diagonal orange line represent subjects with lower IOP at final follow-up compared to their preoperative baseline IOP. The horizontal dotted line marks the 22mmHg success point, so that all points below this line are considered as success.
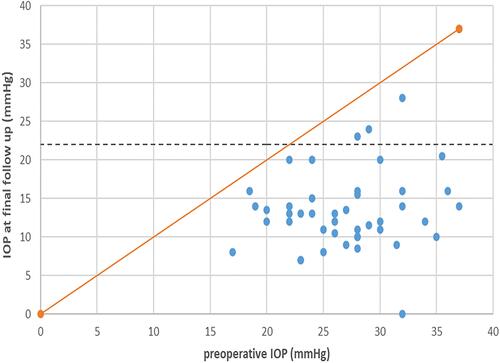
Table 3 Binary Logistic Regression Analysis for Predictors of Success
Figure 2 Kaplan–Meier survival analysis curve for the whole study eyes.
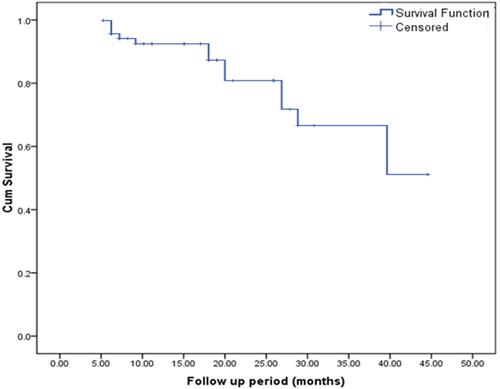
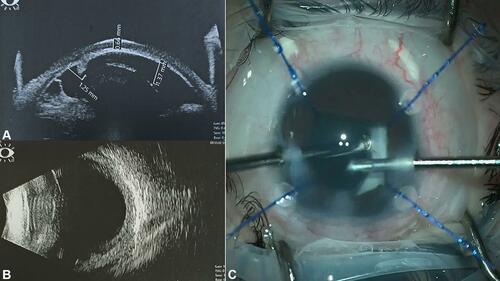
Figure 3 Clinical photos of a case complicated with sever persistent hypotony secondary to cyclitic membrane.
Notes: (A) UBM shows very shallow anterior chamber, peripheral anterior synechia, cyclitic membrane and ciliary body detachment. (B) B-scan ultrasound shows thickening of choroid and annular cilio-choroidal detachment. (C) Intraoperative appearance during debulking of the cyclitic membrane after removal of the crystalline lens.