Figures & data
Table 1 Demographic Data of Normal and Glaucomatous Group
Table 2 EQ-5D-5L, EQ VAS, VFQ-UI and VFQ-28 Between Normal and Glaucomatous Groups
Table 3 EQ-5D-5L, EQ-VAS, VFQ-UI and VFQ-28 Within Glaucomatous Groups
Figure 1 EQ-5D-5L and VFQ-UI bar chart comparing within glaucomatous groups.
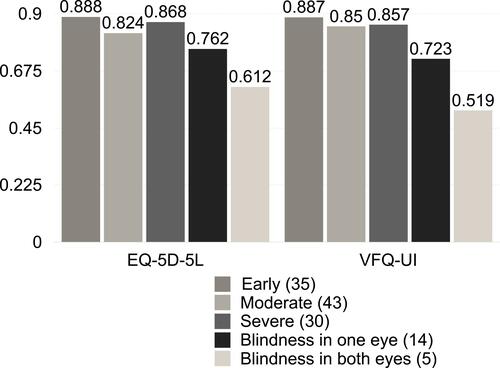
Table 4 VFQ-28 Scale Scores Between Normal and Glaucomatous Groups
Figure 2 VFQ-28 scale scores bar chart comparing between normal and glaucomatous groups.
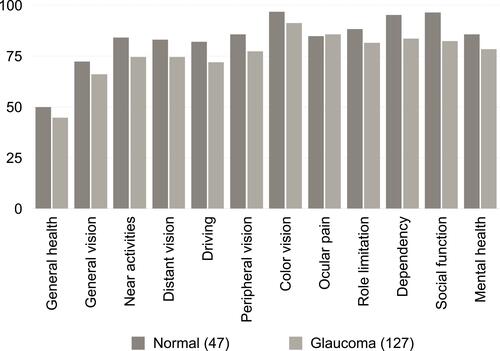
Table 5 VFQ-28 Scale Scores Within Glaucomatous Groups
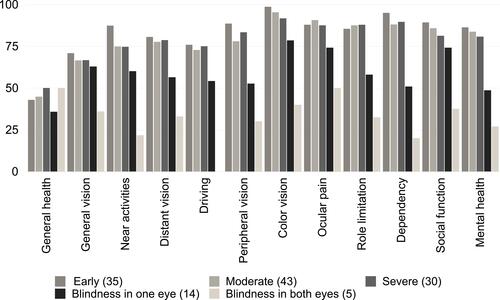
Figure 3 VFQ-28 scale scores bar chart comparing within glaucomatous groups.