
Figures & data
Figure 1 Participant flow diagram.
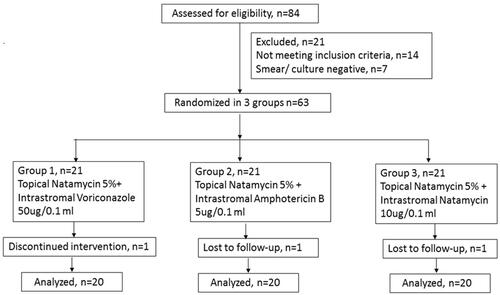
Table 1 Baseline Demographic, Microbiological and Clinical Characteristics of All Three Groups
Table 2 Baseline Features in All Three Groups
Table 3 Comparison of Post-Treatment Parameters of All Three Groups
Figure 2 (A, C and E) Clinical photographs of recalcitrant fungal keratitis at day 0 in voriconazole, natamycin and amphotericin B groups, respectively. (B, D and F) Clinical photographs of cases (depicted in A, C and E) after healing in the voriconazole, natamycin and amphotericin B groups, respectively.
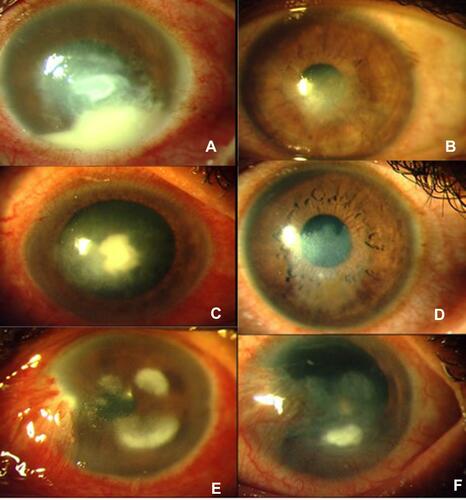
Figure 3 Kaplan–Meier analysis showing the duration of re-epithelialization.
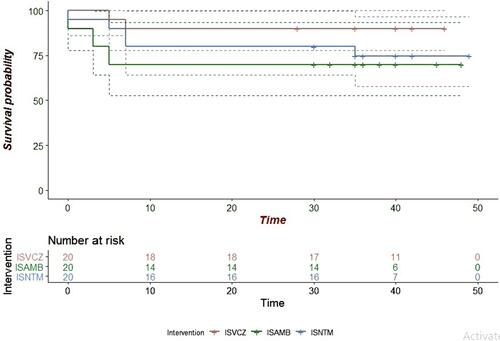
Table 4 Post-Treatment (BCVA) Using ITT and Per-Protocol Analysis Method
Table 5 Comparison of BCVA for Central, Paracentral and Peripheral Ulcers (logMAR)
Table 6 Clinical Details of Patients with Treatment Failure