
Figures & data
Figure 1 Subject flow diagram for post-hoc analysis of post-marketing surveillance (PMS) study of dexamethasone intravitreal implant use in patients with branch retinal vein or central retinal vein occlusion.
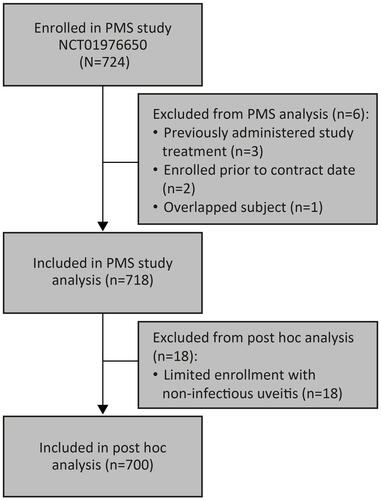
Table 1 Baseline Characteristics and Demographics of Patients Included in the Post-Hoc Analysis
Table 2 Number and Timing of DEX Implant Treatments
Table 3 Mean BCVA in Specified Analysis Windowsa
Figure 2 (A) Mean best-corrected visual acuity and (B) mean change in best-corrected visual acuity from baseline in patients with BRVO or CRVO.
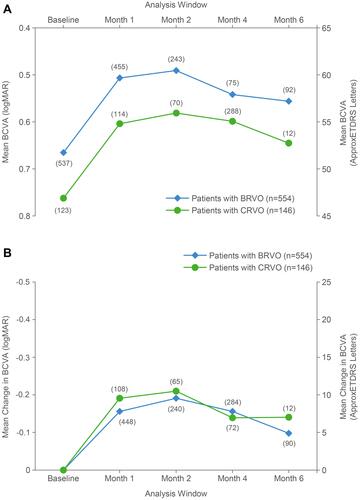
Figure 3 Mean change in best-corrected visual acuity from baseline in (A) BRVO patients and (B) CRVO patients by treatment naivety.
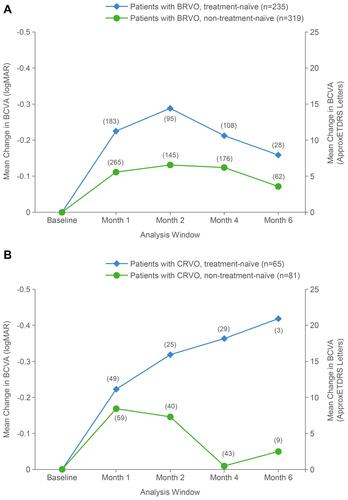
Figure 4 Improvements in best-corrected visual acuity of (A) ≥0 line, (B) ≥1 line, (C) ≥2 line, and (D) ≥3 line from baseline within each analysis window.
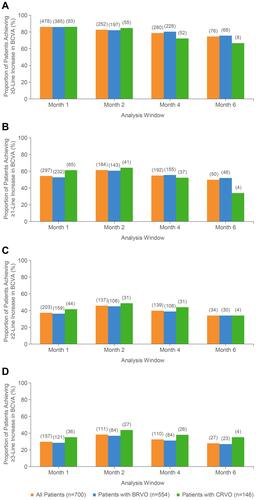
Figure 5 Distribution of best-corrected visual acuity of (A) ≥1 line, (B) ≥2 line, or (C) ≥3 line decreases from baseline within each analysis window.
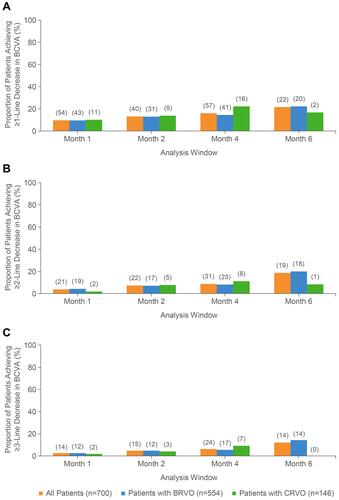
Table 4 Logistic Regression Analysis of Potential Associations with Line Improvement in BCVA in the Month 2 Analysis Windows
Table 5 Summary of Ocular and Systemic AEs, All Eyes