Figures & data
Table 1 Demographic and Clinical Characteristics of Eyes with Type I versus Type II Peters Anomaly
Figure 1 Stratification of visual acuity outcomes of study subjects with Peters anomaly.
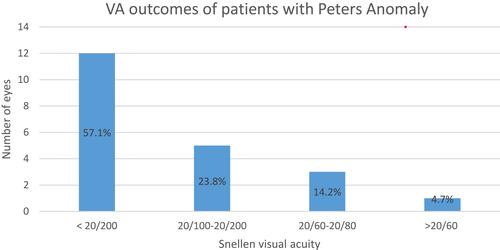
Figure 2 Comparison of eyes with severe visual impairment (VA<20/200) in Type I versus Type II Peters anomaly.
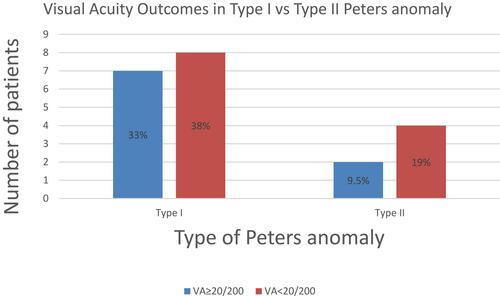
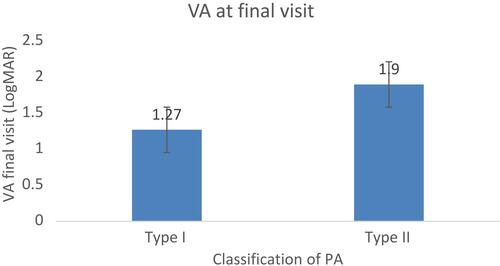
Figure 3 Comparison of mean visual acuity (VA) levels between type I and type II Peters Anomaly (PA).