
Figures & data
Figure 1 Optical coherence tomography image of an eye with a macular hole associated with pathologic myopia demonstrating characteristic findings. (A) Pre-operative macular scan oriented vertically from inferior to superior arcade reveals outward bulge of macula associated with posterior staphyloma. This vertical orientation can more clearly demonstrate these findings. Mirror artifact (arrow) is another commonly associated imaging feature in eyes with pathologic myopia. (B) Pre-operative macular scan oriented horizontally (temporal to nasal) demonstrates less pronounced outward bulge and full-thickness macular hole. Post-operative images from (C) 3-months and (D) 2-years showing closed macular hole.
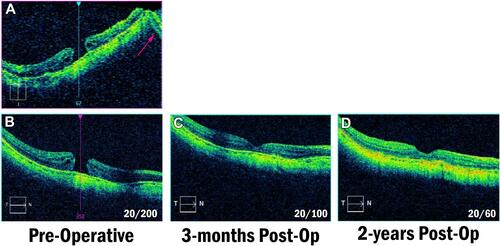
Table 1 Demographics
Table 2 Outcomes
Figure 2 Change in best-corrected visual acuity (BCVA) compared to baseline over time. Negative values indicate a decrease in logMAR which represents improved BCVA. Number of eyes included at each follow-up visit noted next to each data point. Error bars demonstrate 95% confidence intervals.
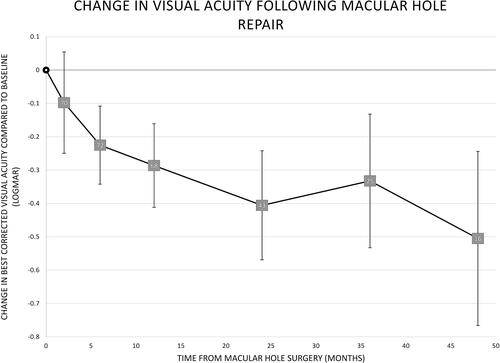
Figure 3 The mean best-corrected visual acuity pre-operatively and at final visit for acute and chronic macular holes. Acute was defined as presenting within 6 months of symptom onset and chronic presented beyond 6 months of symptom onset. Error bars represent standard error of means and (*) indicates statistically significant data (p < 0.05).
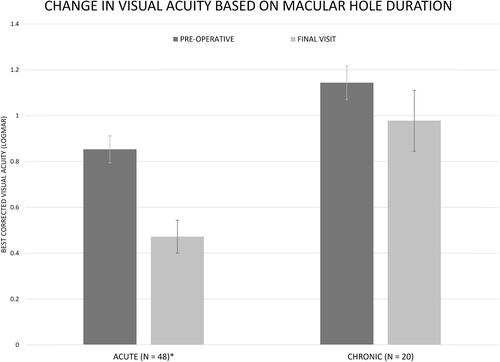
Figure 4 The mean best-corrected visual acuity pre-operatively and at final visit based on stage of macular hole. Error bars represent standard error of means and (*) indicates statistically significant data (p < 0.05).
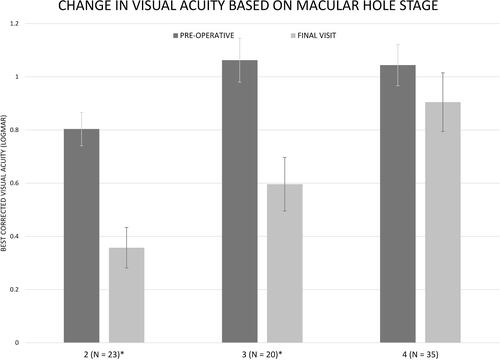
Figure 5 The mean best-corrected visual acuity pre-operatively and at final visit based on size of macular hole on optical coherence tomography (small <250 microns, medium 250 to 400 microns, large >400 microns). Error bars represent standard error of means and (*) indicates statistically significant data (p < 0.05).
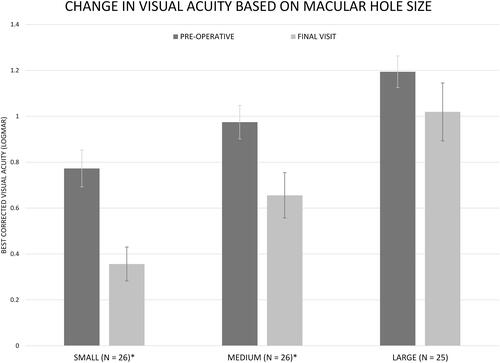
Figure 6 In eyes without pathologic myopia, (A) single surgery closure rates and (B) final closure rates stratified by duration of symptoms, stage of macular hole and size of macular hole. The single surgery closure was defined as successful macular hole closure after one intervention while final closure was defined by macular hole closure at the final follow-up visit independent of number of interventions. (*) indicates statistically significant data (p < 0.05).
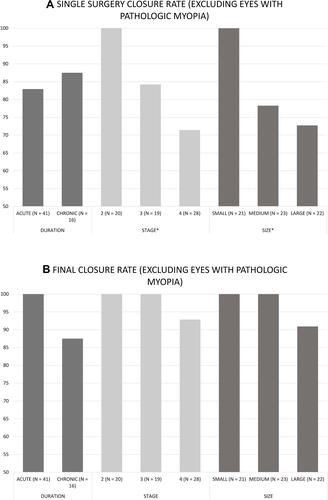
Table 3 Complications